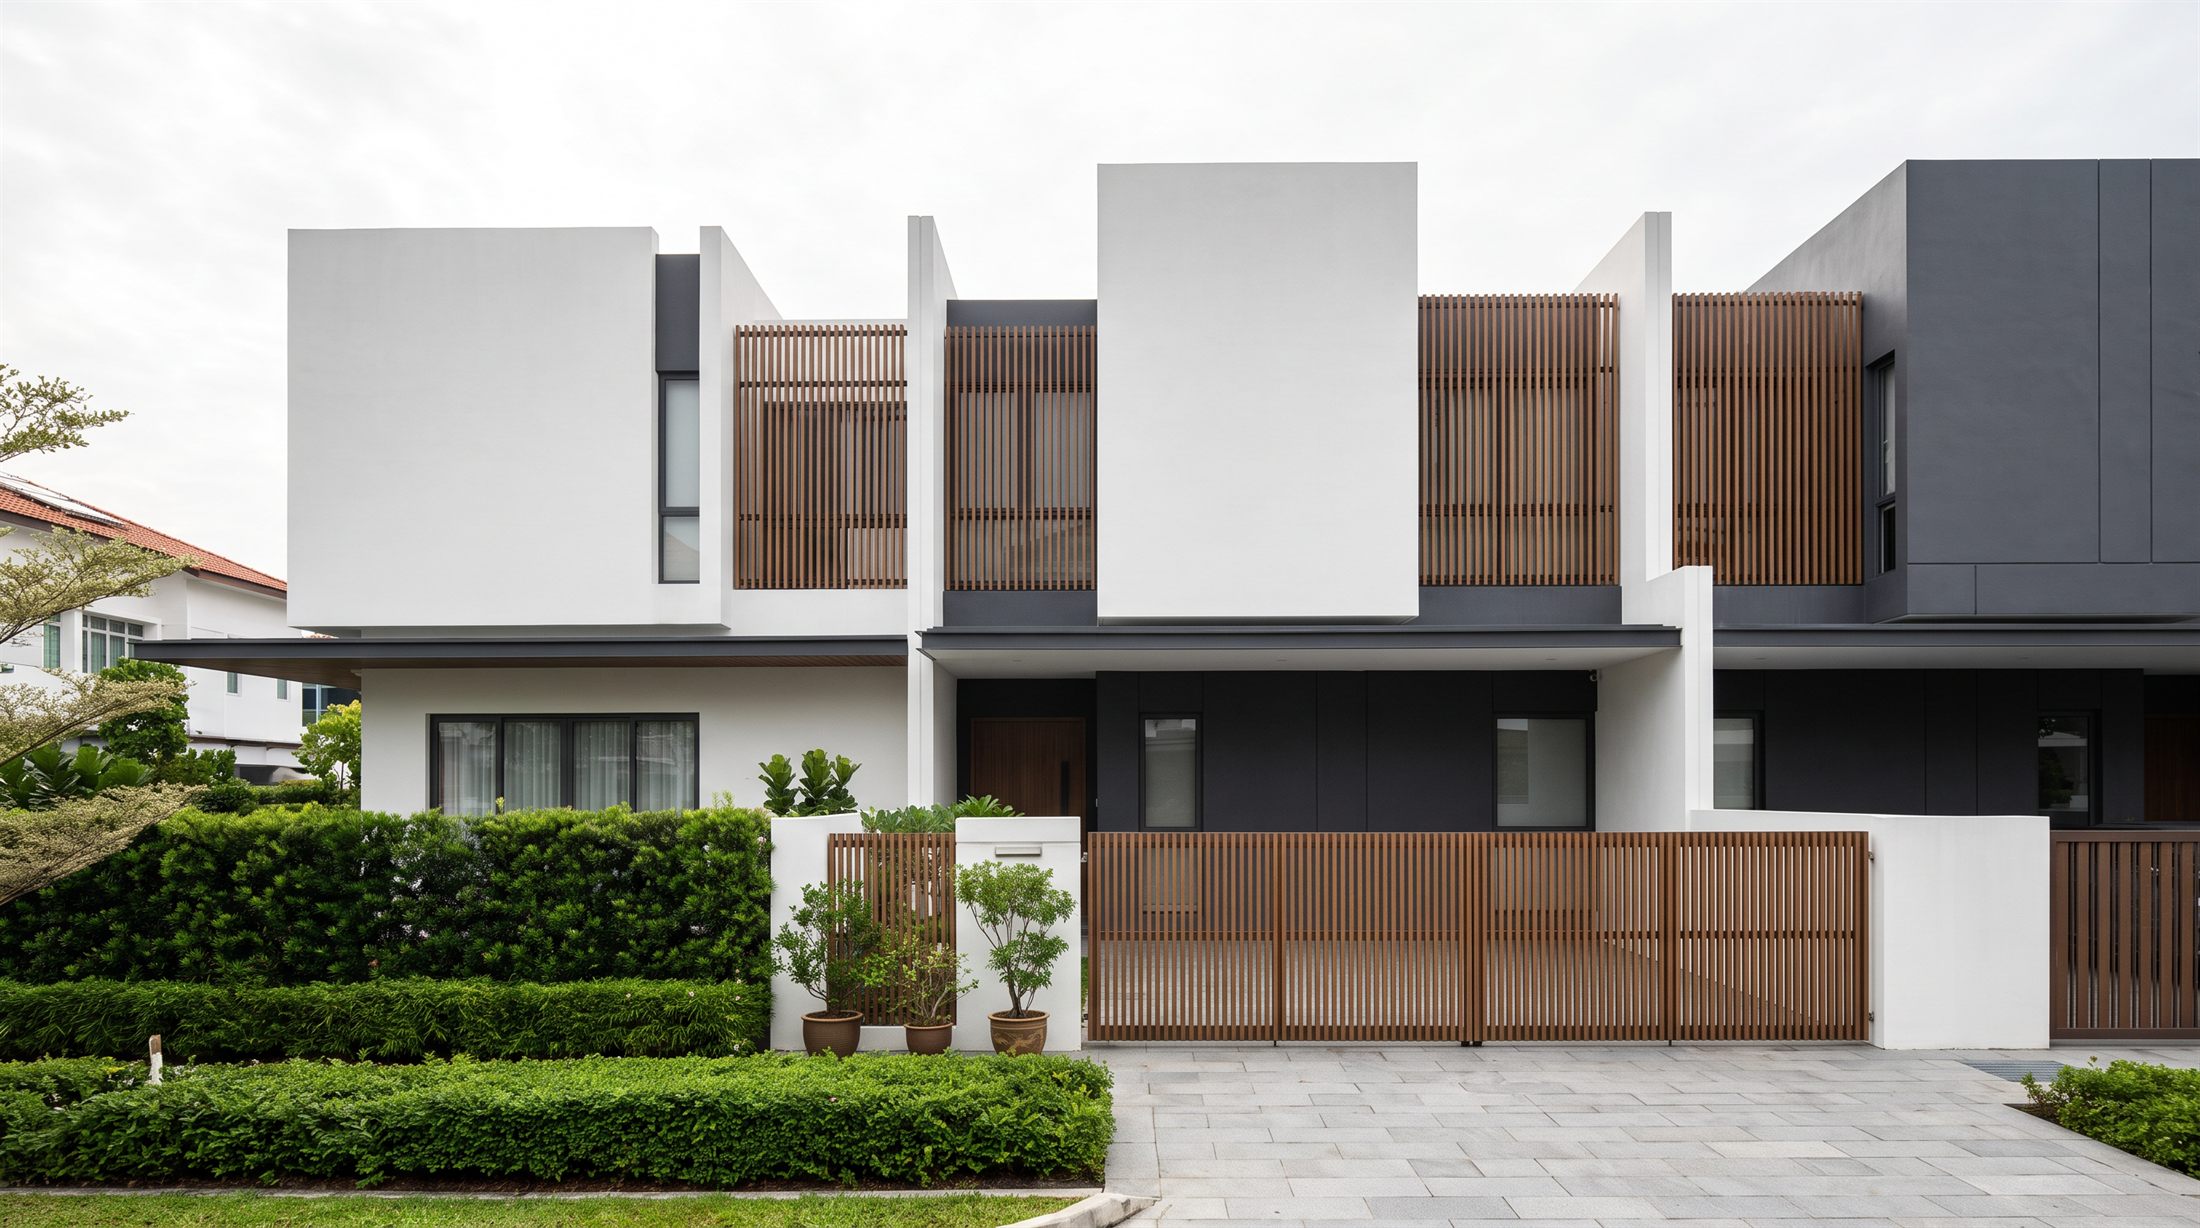
Liquidity · relative PSF · quantum · the asking gapmastplan
Landed is the one Singapore asset class where the buyer is expected to arrive already convinced. This report does the opposite. It takes the four questions that actually separate an underpriced landed house from a merely expensive one, and it checks the market story behind them against the published indices first.
+45.6%
landed price growth, end-2020 to end-2025 — URA
49.5%
of 4Q2025 landed deals transacted below $5M
1 in 38
landed homes changed hands in 2025
Compounded from URA's published annual landed price index changes; quarterly quantum split and transaction count from published landed market research; turnover computed against a landed stock of roughly 70,000 homes.
Before any of the four signals is useful, one claim has to be dealt with — because almost every landed buyer is carrying it, and it is wrong.
The claim to check before you check anything else.
The standard case for landed housing is a syllogism. Land cannot be manufactured. The government releases almost no new landed plots. Therefore landed must outgrow every other residential asset, and therefore paying up for it is always eventually right.
The first two premises are true. The conclusion does not follow, and over the last five years it did not happen.
Three government price indices, rebased to 100 at the end of 2020
HDB resale, private landed and private non-landed, each compounded forward from its own published annual change. Same base, same window, no adjustment. The softest asset in the country — the one with fifteen to twenty-three thousand new units a year — finishes ahead of the hardest one.
HDB resaleLandedNon-landed private
Computed by compounding the published full-year changes in HDB's Resale Price Index and URA's landed and non-landed private residential price indices, 2021 to 2025, from a common base of 100 at 31 December 2020. The vertical axis starts at 95, not zero, so the three series separate legibly.
The same five years, year by year
Full year
HDB resale
Landed
Non-landed
2021
+12.7%
+13.3%
+9.8%
2022
+10.4%
+9.6%
+8.1%
2023
+4.9%
+8.0%
+6.6%
2024
+9.7%
+0.9%
+4.7%
2025
+2.9%
+7.6%
+2.3%
Compounded
+47.4%
+45.6%
+35.5%
mastplan
Published full-year index changes. Landed wins three of the five years and still finishes second, because 2024 — a flat year for landed and a strong one for HDB resale — cost it the whole lead.
Read that table twice, because it contains the two things a landed buyer most needs to hold at once. Landed is the more volatile series, not the more reliable one. It ranges from +0.9% to +13.3% across five years while non-landed never leaves a 2.3% to 9.8% band. Scarcity does not smooth a market. It thins it, and thin markets move in steps.
And the outperformance that does exist is recent and concentrated. Almost the whole landed-over-non-landed gap in 2025 — 7.6% against 2.3%, the widest spread in at least five years — arrived in a single year after a flat one. A buyer entering in 2026 is not buying a smooth five-year trend. They are buying immediately after the steepest twelve months in the series.
The scarcity argument is an argument about supply. It is not an argument about price, and for five years it did not behave like one.
What is actually scarce is the buyer, not the house.
There is a real scarcity story in landed housing. It is just not the one usually told. Roughly seventy thousand landed homes exist in Singapore, around five to six per cent of the total housing stock, and that number barely moves. But the more binding constraint sits on the other side of the transaction.
Landed is closed to foreign persons by statute, not by price.Under the Residential Property Act, a foreign person must obtain approval to buy vacant residential land, a terrace, a semi-detached or a detached house. Condominium units and strata landed inside an approved condominium development need no approval. Landed does.
Permanent residence is not an exemption.A Singapore PR is a foreign person for this purpose. Applications are assessed individually and the published criteria are that the applicant should have been a PR for at least five years and must make an exceptional economic contribution to Singapore, assessed on factors including employment income assessable for tax here.
Sentosa Cove is not the loophole it is remembered as.The Singapore Land Authority states that landed property at Sentosa Cove is not exempted and carries the same approval requirement as landed elsewhere.
Approval takes about thirty working days.That is the published indicative processing time, and it sits inside — not before — a typical option period. It is a timing risk, not a formality.
The consequence is the single most important structural fact in this market and it is almost never stated plainly. Landed housing is a fixed stock sold into a legally capped demand pool. It cannot inflate on foreign inflows the way non-landed can, and it cannot deflate on foreign outflows either. It trades on domestic wealth formation and almost nothing else.
Share of landed home buyers who were HDB owners
The upgrader cohort — the group that historically fed the bottom of the landed market — is shrinking as a proportion of landed buyers for the third year running.
Published landed market research on buyer profile, full-year figures. A falling share does not by itself mean fewer upgraders in absolute terms — total landed volume rose over the same period — but it does mean the marginal landed buyer is increasingly not one.
Sixteen per cent to fourteen to eleven, while the market itself got busier. The buyer pool is not just capped from outside; it is thinning from below. That has a direct implication for anyone shopping at the entry level, and we come back to it under Signal three.
You’ve seen the market baseline
You've seen where the market is. Now see what makes a price defensible.
You’ve seen where the market is. The full report shows how tenure, house type, stamp duty and seller expectations change the price you should actually offer.
The missing variable — tenure, and why the freehold premium on landed went from single digits to nearly sixty per cent in a decade.
Signal two, properly — why detached homes have a LOWER price per square foot than terraces, and what that does to a cross-type comparison.
Signal three — buyer's stamp duty computed tier by tier at landed quantum, and the point at which the six per cent band starts running the deal.
Signal four — the asking-versus-transacted spread by district, and how to tell an anchor from a price.
The pre-offer sequence — what to establish, in what order, before you commit to a number.
Open the full report
Enter your details for instant access — about 30 seconds.
You're in.
The rest of the report is open below.
Instant accessNo account requiredRelevant follow-up only
Four signals, in this order.
The framework below is deliberately narrow. It will not tell you whether a house is good. It tells you whether the price on it is defensible relative to what the same money buys elsewhere — which is a different and much more answerable question. The order matters more than any individual signal.
1
Liquidity first — can this cell trade at all?Before any price comparison, establish whether the district and property type you are looking at produces enough transactions to have a real clearing level. In a cell with a handful of trades a year there is no market price, only a sequence of individual negotiations, and a discount there is not the same thing as a discount in a liquid cell.
2
Relative PSF — same type only, never across types.Compare terrace to terrace and detached to detached. Comparing across types is the most common analytical error in landed and it reliably points the wrong way, for a reason we show below that surprises almost everyone the first time they see it.
3
Quantum sanity check — what does the whole cheque look like?PSF hides the two things that actually decide whether a purchase is survivable: the absolute cheque, and the duty on it. Buyer's stamp duty above three million dollars is charged at six per cent on the excess, which changes the arithmetic materially at landed quantum.
4
Asking versus transacted — is the anchor real?Landed listings sit for a long time, and the ones you can see are disproportionately the ones that have not sold. The visible ask is therefore a biased sample of the market. Price against caveats, not against neighbours.
Everything below this point is one of those four signals with the published data behind it, plus one variable the framework as usually taught leaves out entirely — and which, on the available series, discriminates landed prices harder than district does.
Signal one — most of this market does not trade.
Landed housing recorded 1,852 transactions in 2025, up 11.2% on 2024's 1,664 and the highest annual count in four years. Against a stock of roughly seventy thousand homes, that is a turnover rate of about 2.6% — around one landed home in thirty-eight changing hands in a strong year.
1,852
landed transactions in 2025, a four-year high
491
in 4Q2025 — the busiest quarter since 2Q2022
2.6%
annual turnover against the standing landed stock
Transaction counts from published landed market research; turnover computed against a landed stock of roughly 70,000 homes.
Spread across more than twenty districts and three property types, 1,852 trades is not a lot of price discovery. Most district-and-type cells produce single or low double-digit annual volumes, which is why the first signal has to be liquidity: in a thin cell you are not finding a discount, you are finding the only seller.
Median landed price per square foot, by district
The land-price gradient across the island, from a single published 2026 district tabulation so the districts are directly comparable to one another. Roughly a 2.9× spread from the cheapest to the dearest.
Median transacted price per square foot for landed homes by district, from a published 2026 district tabulation. Directional: the tabulation does not publish sample sizes for every district and mixes property types within a district. Read the gradient, not the decimals.
That chart is Signal two's raw material, but on its own it is close to useless — and the reason is the chart below it. Price per square foot and total quantum are not the same ranking, and a buyer who conflates them will systematically mistake a big plot in a cheap district for a bargain and a small plot in a dear one for a rip-off.
Where the money goes: land price against total cheque
Each dot is a district. Horizontal is the median price per square foot — how dear the land is. Vertical is the median transacted price — how big the cheque is. The two are related but they are not the same question, and the districts that sit off the diagonal are the interesting ones.
Both axes from the same published 2026 district tabulation. Directional. D03 is the clearest off-diagonal case in the set: dearer land than D09 and D11, smaller median plot, so a lower total cheque than D11 despite a higher price per square foot.
D03 against D11 is the whole lesson in one comparison. D03's land is dearer — $3,140 against $2,942 — and yet its median cheque is smaller, $10.99M against $11.18M, because the median plot there is smaller. A buyer ranking by PSF puts D03 above D11. A buyer ranking by quantum puts it below. Neither ranking is wrong; they are answers to different questions, and the mistake is not noticing which one you asked.
The sub-$5M market is half the market
Quarter
Above $5M
Below $5M
Total
3Q2025
244 · 51.5%
230 · 48.5%
474
4Q2025
248 · 50.5%
243 · 49.5%
491
mastplan
Published landed market research, transacted deals by price band. The 3Q total is implied from the published share. Entry-level landed is not a residual category — in the most recent quarter on record it was 49.5% of everything that traded.
That table matters because the entry level is where landed scarcity is most often oversold. It is entirely possible for the number of listings below five million dollars to be small at any given moment while the number of transactions below five million is half the market — and the second number is the one that tells you whether you can buy. Thin listings in a liquid band mean stock is moving, not that it does not exist.
Big brother, small brother — and the size of the step.
The substitution idea is the strongest thing in the standard landed framework. Every sought-after landed district has a neighbour one notch down: same commute, similar stock, materially cheaper land. Buyers who cannot clear the big brother's quantum move to the small brother, and the gap between the two is a live, tradeable number.
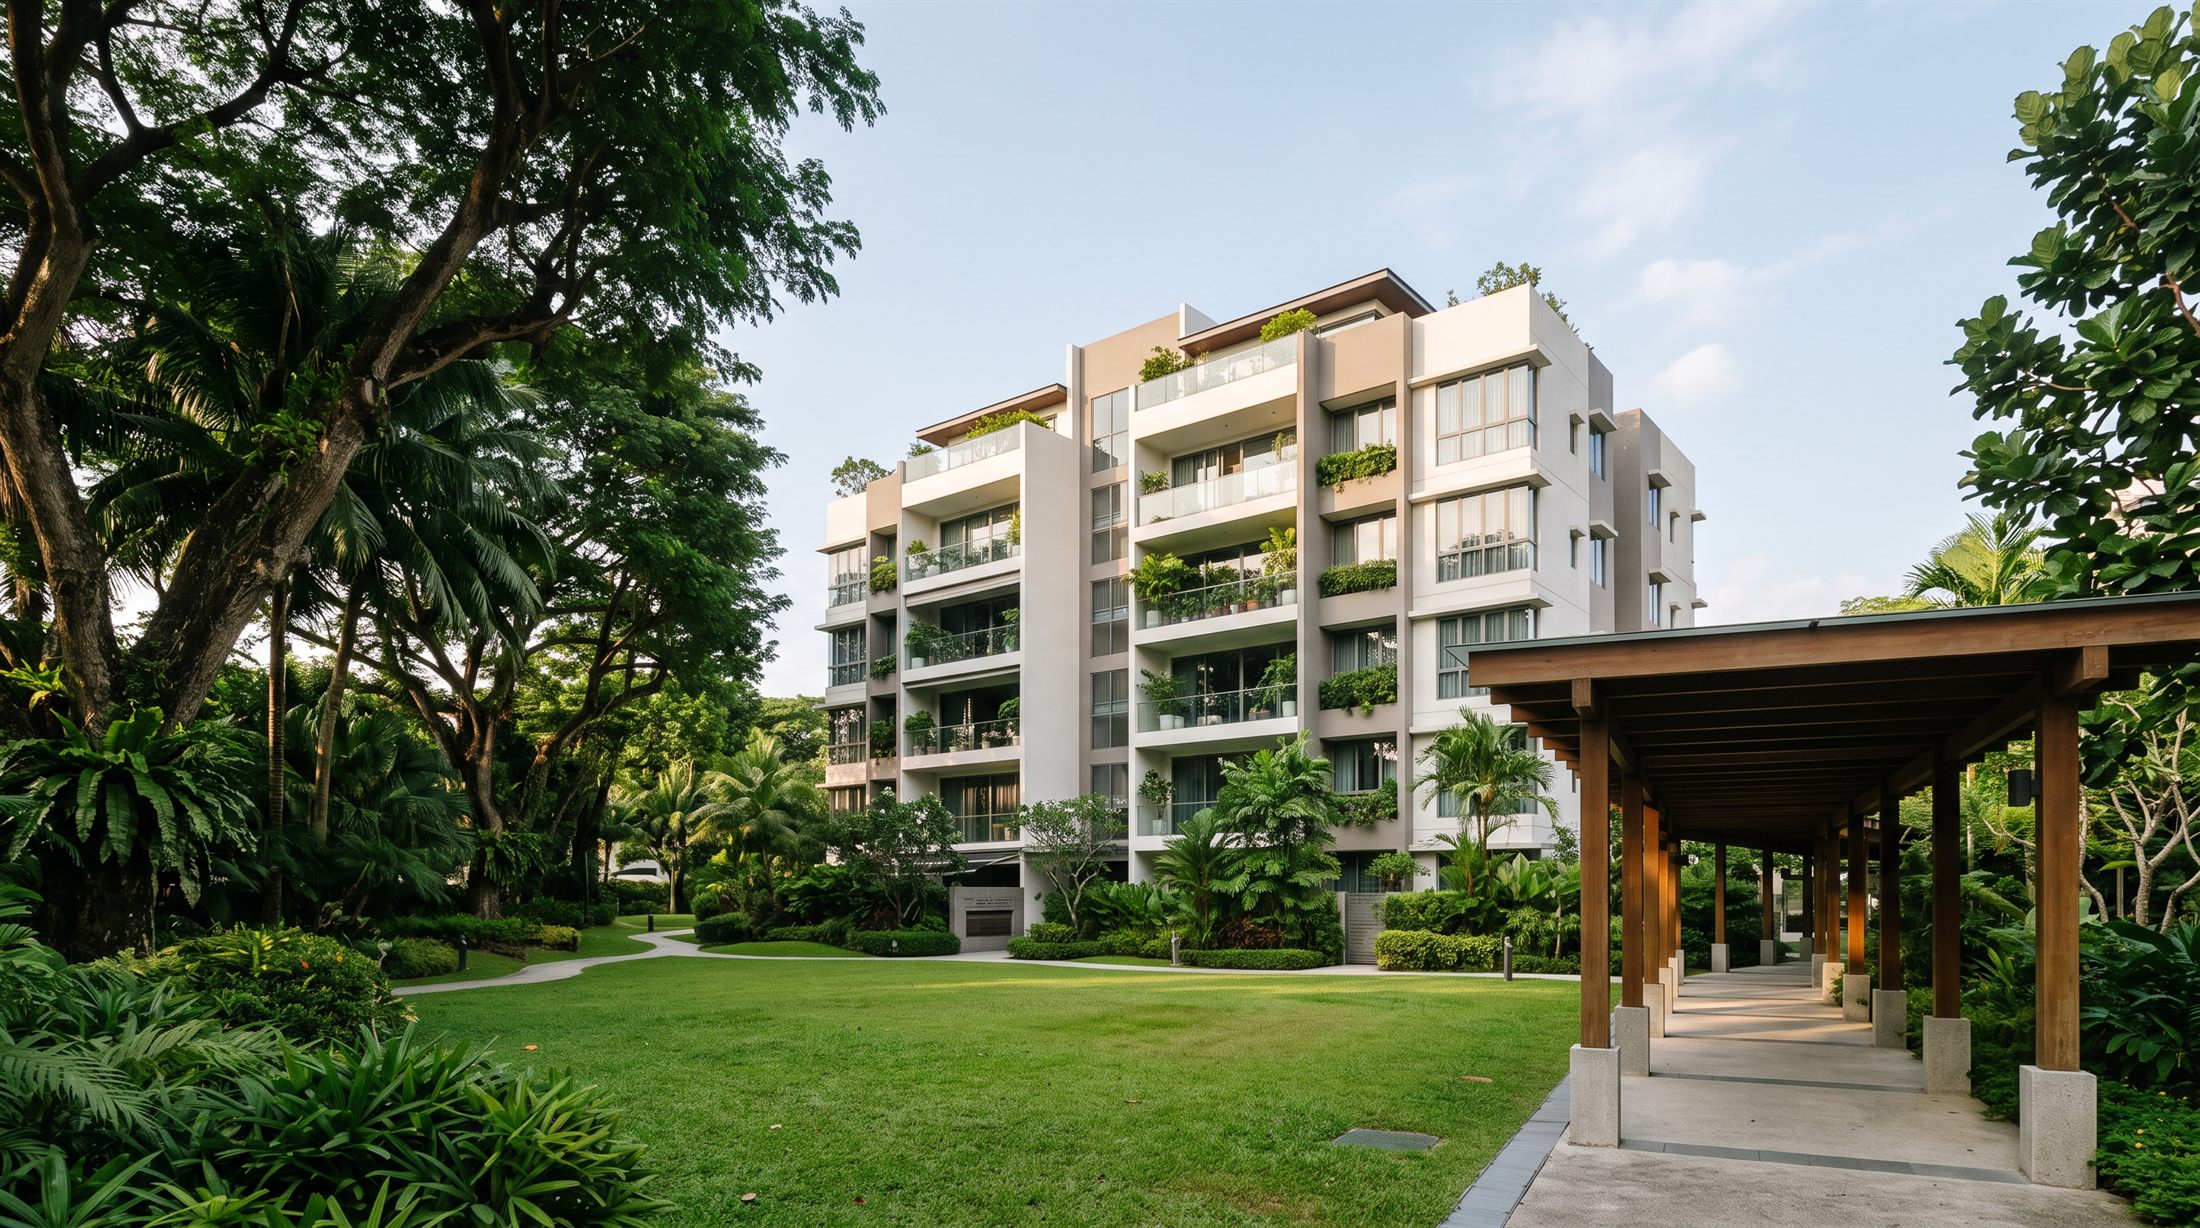
Same street, three price bands — the substitution ladder in one framemastplan
What the standard version gets wrong is treating that gap as a constant. It is not. On a single consistent district tabulation, the step between adjacent landed districts ranges from about four per cent to about twenty-eight per cent — and the size of the step is the signal, not the existence of it.
The step between neighbouring landed districts
Each row is a pair of adjacent districts, cheaper on the left, dearer on the right, with the median landed price per square foot for each. The bar is what you save by moving one district over — and it is nothing like uniform.
Small brotherBig brother
Median landed price per square foot by district, from a single published 2026 district tabulation, so the pairs are internally consistent. Directional. Adjacency is geographical, not a claim that the housing stock in each pair is equivalent.
Two readings come straight off that chart, and they point in opposite directions.
A wide step is an opportunity — if the small brother is liquid.A 28% saving for one district's difference in address is a real arbitrage, provided the cheaper district actually trades. D19 is the most active landed district in the country by volume, which is exactly the combination you want: a big step down in price into a cell that still has price discovery.
A narrow step is a warning, not a bargain.When the gap between a district and its neighbour is four to six per cent, there is no substitution trade left to make. You are paying almost the big brother's price without the big brother's address, and the usual reason the gap is that narrow is that the cheaper district has already been bid up by exactly this logic.
The step is not a forecast of convergence.A narrow gap is often read as evidence that the cheaper district is 'catching up' and will keep going. It is at least as likely to be evidence that the catching up has already happened. There is no published series that resolves this either way, and any claim that a specific gap will keep closing is an opinion, not a measurement.
Which is the whole reason liquidity comes first. A substitution trade into an illiquid district is not a discount; it is a longer holding period wearing a discount's clothes. You will save the twenty-eight per cent going in and pay it back in time and negotiating position going out.
Signal two — the comparison that only works within a type.
The rule is stated everywhere and explained almost nowhere: compare price per square foot within a property type, never across types. The reason is counterintuitive enough that most buyers assume the rule is a technicality. It is not. Cross-type PSF comparison in landed points the wrong way, systematically.
Median price and median price per square foot, by landed type
Bars are the median transacted price. The line is the median price per square foot. They move in opposite directions — the most expensive houses in the country sit on the cheapest land per square foot in the sector.
Median transacted priceMedian price per square foot
Island-wide medians for the fourth quarter of 2025 from published landed market research. The line axis starts at 1,600 rather than zero so the three levels separate; the bar axis starts at zero.
A detached house costs 2.5 times a terrace and its land is cheaper per square foot — $1,869 against $2,264, about 17% less. This is not an anomaly and it is not a market inefficiency. It is the plot-size gradient: as land area rises, the price per unit of it falls, because the pool of buyers who can write the total cheque shrinks faster than the land grows.
What the gradient does to a naive comparison
Terrace
Semi-detached
Detached
Median transacted price
$4.22M
$6.38M
$10.58M
Median price per sq ft
$2,264
$1,874
$1,869
Implied median land area
1,864 sqft
3,404 sqft
5,660 sqft
PSF vs terrace
—
−17%
−17%
4Q2025 transactions
281
151
59
mastplan
Land area is implied by dividing the median price by the median price per square foot and is therefore approximate — a median of a ratio is not the ratio of the medians. Transaction counts are for the quarter.
So a buyer who screens on PSF alone and sees a detached house at $1,900 psf next to a terrace at $2,300 psf concludes the detached is the better value. It may well be. But not for that reason — every detached house in the country looks cheap on that measure, including the overpriced ones. The screen has told them nothing except which property type they are looking at.
Note the last row too. Fifty-nine detached transactions in a quarter, island-wide, across every district. That is Signal one arriving inside Signal two: the type with the most attractive-looking PSF is also the type with the least price discovery behind it.
The variable the framework leaves out — and it is the biggest one.
District, type, plot size, condition, frontage. Every landed framework covers those. Almost none of them cover tenure, and on the available series tenure discriminates landed prices harder than any of them.
Freehold against leasehold landed, average price per square foot
Two lines that used to be nearly the same line. Through the 1990s and 2000s, leasehold landed traded within about fifteen per cent of freehold. Then it stopped.
Freehold / 999-year99-year leasehold
Average transacted price per square foot for landed homes by tenure, from a published long-run tenure analysis of landed transactions. Averages, not medians, and unadjusted for district, type or plot size — so the levels are indicative and the divergence, not any single year, is the finding. Points are spaced evenly by observation rather than by time — every step is five years except the last one, which is one. The series ends in 2021.
The freehold premium on landed, by year
The same two series expressed as one number: how much more freehold land costs per square foot than leasehold land in the same year.
Computed from the same tenure analysis. The 2010-to-2015 step is the structural break; before it the premium sat in single digits to mid-teens, after it in the forties and fifties.
From 7.6% in 2010 to 57.2% in 2020. That is not a drift, it is a repricing, and the most likely explanation is the simplest one: a 99-year landed lease granted in the 1990s had more than ninety years to run in 2000 and has around seventy now. Lease decay is not linear in its effect on price. It accelerates, and it accelerates hardest once financing and CPF usage rules start to bite on the remaining term.
Tenure is not a preference. It is a financing constraint.The amount a buyer can borrow and the amount of CPF they can use against a property are both a function of the remaining lease relative to the buyer's age. As a lease shortens, the pool of buyers who can finance it shrinks — which is the same mechanism that makes detached land cheaper per square foot, running in a different direction.
A leasehold landed 'bargain' has to clear a much higher bar.If a 99-year landed house is 30% cheaper per square foot than a comparable freehold one, that is not a discount — on this series it is a smaller discount than the market average premium, which means it is priced above the tenure trend, not below it.
This series ends in 2021 and is unadjusted.It does not control for district, property type or plot size, and the last observation is several years old. Treat the direction and the magnitude of the break as the finding and do not use any individual year's figure as a valuation input.
The practical instruction is short. Establish tenure before you establish anything else about a landed listing, and never compare a leasehold house to a freehold one on price per square foot without saying out loud what the tenure gap in that pocket currently is. On the only long-run series available, that gap is larger than the gap between the cheapest and dearest halves of the island.
Signal three — the cheque, and the tax on the cheque.
Price per square foot is a comparison tool. It is not a budget. At landed quantum the thing that decides whether a purchase is survivable is the absolute number and the duty sitting on top of it — and buyer's stamp duty in Singapore is steeply progressive in a way that is invisible until you cross three million dollars.
Buyer's stamp duty on residential property
Band
Rate
Duty in this band
Cumulative
First $180,000
1%
$1,800
$1,800
Next $180,000
2%
$3,600
$5,400
Next $640,000
3%
$19,200
$24,600
Next $500,000
4%
$20,000
$44,600
Next $1,500,000
5%
$75,000
$119,600
Above $3,000,000
6%
6% of the excess
$119,600 + 6%
mastplan
The published residential buyer's stamp duty schedule, applying to properties acquired on or after 15 February 2023. Every landed transaction at the medians shown earlier in this report sits in the top band.
Where the stamp duty actually comes from, at three landed quantums
The same duty schedule applied to the fourth-quarter 2025 median for each landed type. The first three bands are identical in every case — $24,600, flat. Everything that scales is the six per cent band on top.
Computed directly from the published residential buyer's stamp duty schedule effective 15 February 2023, applied to the island-wide 4Q2025 median transacted price for each landed type. Exact arithmetic, not an estimate.
Stamp duty as a share of purchase price
Because the top band never ends, the effective duty rate keeps climbing with quantum. It never reaches six per cent, but it converges on it.
Total buyer's stamp duty divided by purchase price, computed from the published schedule. Additional buyer's stamp duty is not included — it depends on residency status and the number of residential properties already held, and for a Singapore Citizen buying a first residential property it is nil.
The step from a $4.22M terrace to a $6.38M semi-detached is $2.16M of price and $129,600 of additional duty — the whole increment charged at six per cent, because both sit above the threshold. Stepping up from terrace to detached adds $381,600 of duty on its own, which is more than the entire duty on a $6M non-landed purchase.
None of that is a reason not to buy. It is a reason to run the quantum check before the PSF check, because duty is the one cost in the transaction that scales linearly with the mistake and cannot be negotiated afterwards.
Signal four — the ask is not the price.
The last signal is the one that costs buyers the most money, and it is a sampling problem rather than a valuation one. Listings are visible; transactions are not. And because landed listings sit for a long time in thin districts, the listings a buyer can see are disproportionately the ones that have not sold. The anchor is built out of the failures.
How far detached asking prices sit above transacted levels, by district
The gap between the average standing ask and the transacted level in the same district and type. This is a directional ranking of where the visible anchor is most misleading — read the ordering, not the decimal.
Asking premium over transacted level, detached homes, by district. Directional. The underlying sample size and observation window are not published, so treat the ordering as the finding and the individual percentages as approximate.
What negotiating from the ask costs, on a $6M transacted level
District
Asking premium
The ask
10% off the ask
D05 · Detached
+175%
$16.5M
$14.9M — still $8.9M over
D10 · Detached
+80%
$10.8M
$9.7M — still $3.7M over
D17 · Detached
+70%
$10.2M
$9.2M — still $3.2M over
D11 · Detached
+53%
$9.2M
$8.3M — still $2.3M over
D15 · Detached
+32%
$7.9M
$7.1M — still $1.1M over
mastplan
Illustrative. A $6M transacted level marked up by each district's asking premium, then discounted by a conventional 10% negotiation, to show that percentage-off-ask does not reach a defensible price when the ask is a multiple.
That table is a model, but the mechanic is real and it is the single most useful thing on this page. Negotiating a percentage off the ask is not a strategy in landed. It is a way of losing slowly. Ten per cent off a 175% premium is still 148% over the transacted level.
Price against caveats. Everything else in the transaction is negotiable; the record of what the street actually cleared at is not.
Caveat data is public. Pull every transaction for the specific micro-pocket — street, property type, plot-size band, last twenty-four months — and build the number from those. If the pocket has produced fewer than about five comparable transactions in that window, you are back at Signal one and the honest answer is that there is no market price to find.
What makes a house underpriced, and what only makes it cheap.
Once the four signals say a price is defensible, there is a second question underneath: is this house cheap because of something that can be changed, or because of something that cannot? The distinction runs through every landed purchase and it is worth being brutally explicit about it.
The plot decides more than the house doesmastplan
Cannot be changed — this is the plot's DNA.Land area, frontage width, shape and regularity, corner or intermediate position, the gradient of the site, the road it fronts, the direction it faces, and what is legally permitted on it under the prevailing development control parameters. None of this moves. A discount here is not a discount; it is the price.
Can be changed — this is value-add.Condition, layout, finishes, the age and state of the structure, and in many cases the envelope itself through an addition-and-alteration or a rebuild. A house that is cheap because it is tired is a genuinely different proposition from one that is cheap because it is on a 4.5-metre frontage.
The two are constantly confused, in both directions.Buyers reject sound plots for cosmetic reasons and accept poor plots because the interior photographs well. The test is simple: if the reason this house is cheap would survive a full rebuild, it is DNA and it will be there when you sell.
Rebuild cost is not a single number.Construction cost per square foot of built-up area varies with specification, site access, structural complexity and the state of the market for contractors. Any flat per-square-foot figure quoted without a specification attached is a placeholder, not a budget, and should be replaced with a quantity surveyor's number before it is used to price a purchase.
Subdivision potential is a professional judgement, not a rule of thumb.Whether a large plot can be split into two products is assessed against the prevailing URA development control parameters for that specific plot — frontage, area, setbacks, access and the envelope permitted in that landed housing area — and must be confirmed by a qualified person for the plot in question. Frontage thresholds circulated as rules of thumb are not statutory and do not survive contact with a specific site.
The practical consequence is that a value-add discount has a ceiling and a DNA discount does not. You can spend your way out of tired. You cannot spend your way out of a narrow frontage on a busy road, and the next buyer will apply exactly the same discount you did — plus whatever the market has moved in the meantime.
What holding it actually looks like.
Almost every landed purchase is discussed as a price and settled as a twenty-five year cash-flow commitment. The figure below is an illustration of the second thing, with every assumption stated on it. It is a model of a mechanism, not a forecast of a price.
An illustrative equity build on a median terrace purchase
Purchase at $4.22M — the island-wide 4Q2025 terrace median — with a 75% loan over 30 years at a flat 3.5%, and property value compounding at 3.0% a year. The blue wedge is equity; the dark wedge is the outstanding loan.
Asset valueEquityMortgage
ILLUSTRATIVE MODEL, NOT A FORECAST. The 3.0% annual value assumption is chosen deliberately below the 5–7% published 2026 view for landed; a lower assumption is used because the purpose of the figure is the shape of the equity build, not a price call. The 75% loan-to-value is the regulatory ceiling for a first residential property loan, not a recommendation. Interest is held flat at 3.5% for the full term, which no real loan does. Stamp duty, legal costs, property tax, maintenance and any renovation are excluded entirely. Actual outcomes will differ, possibly by a great deal.
Three things are worth taking from that shape and none of them are the ending number.
Almost all of the early equity is the deposit, not the market.At year five, on these assumptions, the great majority of equity is still the original 25% down payment plus principal repaid. Price growth is a minor contributor for the first several years and would be a negative one in any period where landed goes flat — as it did in 2024, at +0.9%.
The loan runs off slowly at the front and quickly at the back.On a 30-year amortisation the first five years repay a small fraction of principal. The crossover point where the equity wedge overtakes the debt wedge is the number worth knowing for your own situation, and it moves substantially with rate and tenure.
Nothing in this figure includes the costs of getting in or out.Buyer's stamp duty alone on this purchase is $192,800 — computed exactly, earlier on this page. Add legal fees, valuation, property tax, insurance and whatever the house needs, and the true break-even is materially later than the figure suggests.
The sequence to run before you make an offer.
In order, because the order is what stops you from doing expensive analysis on a house you were never going to be able to price.
1
Establish tenure, and stop if it is leasehold until you have priced the tenure gap.Freehold, 999-year or 99-year, and if leasehold, the exact remaining term. This is a one-minute check that changes the entire comparison set, and on the only long-run series available it is worth more than district.
2
Count the transactions in the exact cell.Same district, same property type, same broad plot-size band, last twenty-four months. Fewer than about five and there is no clearing level to find — which is a valid answer, not a failure of the search.
3
Build the price from caveats, never from listings.Transacted records only. If you cannot construct a number without referring to an asking price, you do not yet have a number.
4
Compare within type only.Terrace to terrace, semi-detached to semi-detached, detached to detached. A cross-type PSF comparison will tell you that detached is cheap. Every detached house is cheap on that measure, including the bad ones.
5
Run the full quantum, including duty, before you fall in love with the PSF.Purchase price plus buyer's stamp duty computed tier by tier, plus legal and valuation, plus a realistic works budget from a quantity surveyor rather than a per-square-foot rule of thumb. That total, not the price, is what you are committing to.
6
Separate the DNA from the value-add, in writing.List the reasons this house is cheap and mark each one as changeable or permanent. If the permanent list is longer than the changeable one, the discount is the price and there is no upside to capture.
7
Confirm eligibility and timing before the option, not after.If any buyer on the title is not a Singapore Citizen, approval under the Residential Property Act is required and the published indicative processing time is about thirty working days. That sits inside a normal option period, not before it.
8
Decide your walk-away number and write it down before the first viewing.The single most reliable predictor of overpaying in a thin market is arriving without a number. Everything above exists to produce that number; the discipline is refusing to revise it upward in the room.
The bottom line
Scarcity is real; the growth conclusion drawn from it is not. Rebased to end-2020, HDB resale finished 2025 at 147.4 and landed at 145.6. The softest asset in the country outgrew the hardest one over five years.
The binding constraint is the buyer pool, not the stock. Landed is closed to foreign persons without approval — permanent residents included, Sentosa Cove included — so it trades on domestic wealth formation and almost nothing else.
Liquidity comes before price, every time. 1,852 transactions in 2025 across roughly 70,000 homes is about one in thirty-eight. Most district-and-type cells do not produce a clearing level, and a discount in a cell with no clearing level is not a discount.
Entry-level landed is half the market, not a rounding error. 49.5% of fourth-quarter 2025 transactions cleared below $5M.
Tenure is the largest single discriminator and most frameworks omit it. The freehold premium on landed went from 7.6% in 2010 to 57.2% in 2020 on the available series.
Compare within type only. Detached land is about 17% cheaper per square foot than terrace land. Every detached house looks cheap on a cross-type screen.
Duty is the cost you cannot negotiate. Above $3M every additional dollar carries 6% buyer's stamp duty — $192,800 on a median terrace, $574,400 on a median detached.
Never negotiate a percentage off the ask. Ten per cent off a 175% premium is still 148% above the transacted level. Price against caveats.
mastplan
How this was put together, and where it is weak.
Every claim on this page is either computed from a published index, computed from a published statutory schedule, or explicitly labelled as directional or illustrative. Where the widely-circulated version of a figure did not reconcile, the published series was used and the difference is stated below rather than quietly corrected.
The rebased index comparison is arithmetic, not modelling.Each series is its own published full-year changes compounded from 100 at 31 December 2020. No seasonal adjustment, no rebasing to a common quality mix. The three indices measure different populations and are not perfectly comparable in level — which is exactly why they are shown rebased and as growth rather than as prices.
The commonly quoted asset-class table could not be reproduced.The '+24% HDB, +24% non-landed, +26% landed' figures circulated for 2019–2025 do not match either index over any window we could reconstruct. The published series are used instead and shown year by year so the arithmetic is checkable.
District figures are directional and single-sourced.The district PSF and quantum figures come from one published 2026 tabulation, used throughout so the districts stay comparable to one another. Sample sizes are not published for every district and property types are mixed within a district. The ordering is the finding.
The tenure series is unadjusted and ends in 2021.Averages rather than medians, not controlled for district, type or plot size, and several years old at the last observation. The structural break between 2010 and 2015 is large enough to survive those caveats; no individual year's figure should be used as a valuation input.
Asking-premium percentages carry no published sample or window.They are a directional ranking of where the visible anchor is most misleading. The negotiation table built on them is explicitly an illustration.
The holding model is a model.Flat interest, flat growth, no costs, no vacancy, no rate reset. It is included to show the shape of an equity build, and it is labelled on the figure itself as not a forecast.
Stamp duty arithmetic is exact; everything around it is not.The buyer's stamp duty figures are computed tier by tier from the published schedule effective 15 February 2023 and are exact for the quantums shown. Additional buyer's stamp duty is excluded because it depends on residency status and existing holdings.
One circulated claim was dropped rather than repeated.The assertion that the terrace price gap between two specific districts 'narrowed from 22% in 2015 to roughly 13.5% today' has no published series behind it that we could locate, and it is not reproduced here.
The largest limitation is that this is a national read of a market that is not national. Landed is several dozen small markets sharing a price index. Everything here is true at the aggregate and can be wrong about a specific street. The two variables that move an individual landed price most — built-up area, and where a plot sits on the size gradient within its own type and pocket — are not in any public dataset at all.
The house, not the index
Get the caveats for your shortlist.
This report can rank districts, types and tenures. It cannot price the three houses you are actually deciding between — Signal one and Signal four are both reasons why. Send us the shortlist and we'll come back with the transacted comps for each specific pocket, a liquidity read on whether those cells produce a clearing level at all, the tenure position, and the full quantum including duty computed line by line.
Transacted comps for your exact pocketA liquidity read on each cellTenure and remaining-lease positionFull quantum including duty, computedDNA versus value-add, separated
Got it.
We'll come back to you shortly with your read.
About the figures Landed and non-landed private residential price index changes are from URA's published quarterly real estate statistics for the full years 2021 to 2025; HDB resale price index changes are from HDB's published quarterly Resale Price Index over the same years. Both are indicative as at publication and subject to revision by the relevant authorities. The rebased series are computed by compounding those published annual changes from a base of 100 at 31 December 2020. Landed transaction counts, quarterly price-band splits, 4Q2025 medians by property type and buyer-profile shares are from published landed market research. District median prices and price per square foot are from a published 2026 district tabulation and are directional; sample sizes are not published for every district. The freehold-versus-leasehold series is from a published long-run tenure analysis of landed transactions, uses averages rather than medians, is not adjusted for district, type or plot size, and ends in 2021. Buyer's stamp duty is computed tier by tier from the published residential schedule effective 15 February 2023; additional buyer's stamp duty is excluded as it depends on residency status and existing holdings. Rules on foreign and permanent-resident acquisition of landed property are as published by the Singapore Land Authority under the Residential Property Act and are summarised here, not reproduced in full. Asking-premium figures are directional and carry no published sample size or observation window. The negotiation table and the equity build are clearly-labelled illustrative models, not measured results. Subdivision potential is assessed against the prevailing URA development control parameters for the specific plot and must be confirmed by a qualified person. Published for educational purposes; nothing here is a valuation, an offer, or financial advice. Please check with a professional before making any property decision. See our full Disclaimer.
Create your account or sign in
One account unlocks every gated resource. New members create an account here; returning members use the same form to sign in.