 plan
planWhy Singapore state land costs rose as tender fields thinned
A 63-site calculation shows a 58% decade-long rise, but changing site mixes, joint bids and future housing supply complicate the headline.
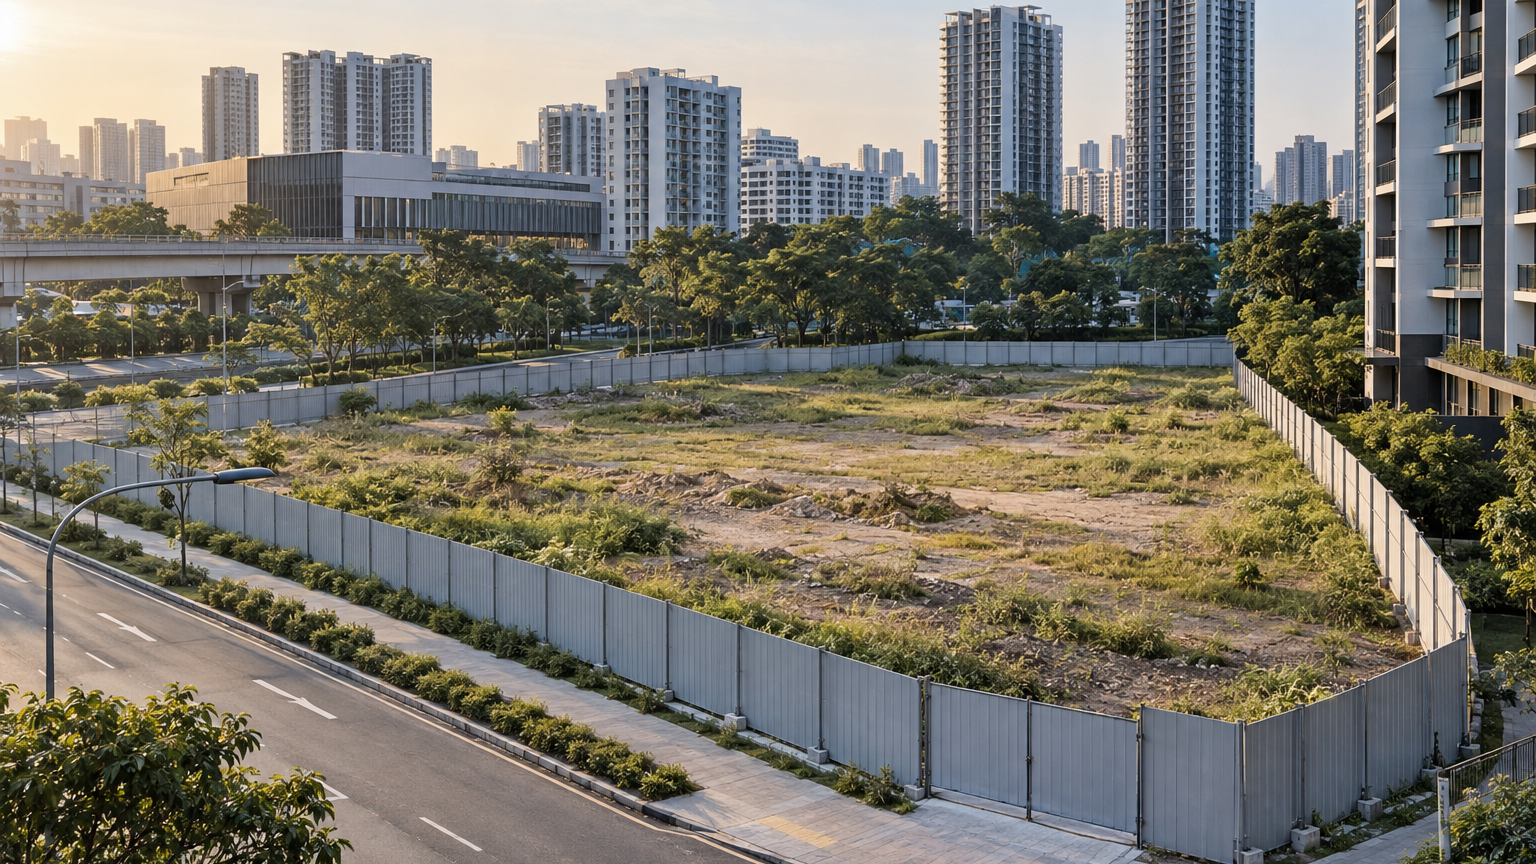
A small state land parcel at Lorong Puntong and Sin Ming Avenue fetched $208.1 million, or $1,612 per square foot per plot ratio (psf ppr), in September 2026. The rate set a reported residential land record for the Rest of Central Region, although the site may yield only about 140 homes.
The result brings a longer rise into focus. Across 63 residential Government Land Sales (GLS) sites, a weighted calculation put the average land rate at $1,312 psf ppr in 2025, up from $833 psf ppr in 2016. That is an increase of roughly 58%, but it is a study of selected land awards rather than an official URA land-price index.
What psf ppr tells us
Psf ppr is the price paid for land divided by the maximum gross floor area allowed on it. Put simply, it shows how much a developer paid for each square foot of potential buildable floor space.
It is not the eventual selling price of a condo unit. After buying the site, the developer must still meet construction, financing, professional, marketing and tax costs. Some permitted floor area will also go towards shared or non-saleable spaces rather than private apartment interiors.
URA’s past-sales database is the primary record for awarded state sites. It provides details such as location, intended use, tender dates and the successful developer, together with a downloadable historical dataset.
There is also a technical break within the decade. Harmonised gross floor area rules apply to GLS sites launched from 1 September 2022, changing how certain spaces are counted. Because permitted floor area is part of the psf-ppr calculation, figures from opposite sides of that change are not perfectly comparable.
Higher prices, but fewer separate bids
The surprising part of the decade-long rise is what did not happen. Tender fields did not steadily become more crowded as winning land rates climbed.
From 2016 to 2018, residential tenders attracted an annual average of 7.9 to 13.3 bids. Since 2022, the average has not exceeded 6.2. Joint ventures have become more common, but the available analysis found no consistent premium among sites won by these partnerships.
A joint venture allows two or more developers to make one offer together. This can help them share the financing burden and risk of a large project, but it also means several interested companies appear as one tender submission rather than several competing bids.
That makes the raw bid count an incomplete measure of interest. Six separate bids from six companies and four bids involving several partnerships may represent different numbers of firms, balance sheets and risk appetites.
Winning prices are also set at the margin: the highest acceptable offer for that particular parcel. A tender does not need a dozen bidders to produce an expensive result if two or three well-funded groups independently place a high value on the site.
Three pressures behind the climb
The first pressure comes from expected home-sale revenue. New-sale prices for non-landed private homes, excluding executive condominiums, rose 84% from 2016 to 2025 in the decade analysis. URA’s broader private residential property price index rose 52% between the first quarter of 2016 and the fourth quarter of 2025.
The measures cover different groups of homes, so they should not be treated as interchangeable. They nevertheless describe a market in which developers could model higher potential revenue than they could at the start of the decade.
The second pressure is replenishment. Developers sell down their stock over time and need new sites if they want projects to launch in future years. A company with few remaining units or sites may value a suitable parcel more highly than one already managing several major developments.
The third is the availability of alternatives. Developers can acquire land through the state’s GLS programme or by buying an existing private estate through a collective sale, commonly called an en-bloc sale. With fewer collective transactions completing after the busy 2017–2018 cycle, state tenders became a more important dependable source of development land.
These pressures can overlap. A developer may bid strongly because it expects sale prices to hold, needs to refill its project pipeline and sees few comparable private sites available. That is more plausible than reducing every tender outcome to the number of envelopes submitted.
Why the annual average can jump
A weighted annual average is affected by the sites sold in that year. A costly central parcel with substantial permitted floor area can pull the figure upwards more strongly than a small suburban plot.
This is why the decade figures should not be read as though the same piece of land simply appreciated from $833 to $1,312 psf ppr. Each year contains a different combination of locations, plot sizes, planning conditions and development opportunities.
The mix matters to homebuyers because location affects what developers believe completed homes can achieve. A plot near an MRT station or established amenities may support a different bid from a less connected site, even if both are sold in the same year.
The Lorong Puntong result is therefore useful as a concrete example of what one city-fringe parcel commanded. It does not establish a new land value for every district, nor does the decade average function as a universal starting point for future tenders.
Does costly land set a floor for condo prices?
Higher land cost puts pressure on a project’s finances, but it does not create a fixed retail price. Developers can adjust apartment sizes, design efficiency, specifications, marketing expenditure and profit expectations. Construction and financing costs may also change before the homes reach buyers.
Future supply adds another constraint. In June 2026, URA said the full-year Confirmed List would provide 9,320 private homes, the highest annual supply since 2013. Confirmed List sites are scheduled for sale, unlike Reserve List sites, which are generally triggered only after sufficient developer interest emerges.
URA also placed the wider pipeline at about 61,000 private homes, including executive condominiums. Around 32,000 unsold units were expected to be available for sale over approximately the following two years.
That pipeline means developers paying high land rates will eventually have to launch into a market with competing projects. Buyers, meanwhile, will compare complete homes and monthly affordability—not land rates in isolation.
The decade’s clearest lesson is not that every new condo must become 58% dearer. It is that developers have accepted much higher land costs even as separate tender bids declined. Whether those bids work will be decided later, when the resulting homes meet buyers and competing supply.