 plan
planWhy Singapore Resale Homes Recorded Higher Median Returns Than New Units
A 630,000-transaction analysis shows how paying a premium for a new home can raise the hurdle at resale.
A 30-year-old medical professional paid S$2.1 million in 2023 for a 700 sq ft freehold two-bedroom condominium near Holland Village. With a larger family home likely to be needed next, his goal for the eventual sale is surprisingly modest: to break even.
His predicament helps explain a much bigger set of numbers. Researcher Vairavan Shanmugam’s reported analysis of more than 630,000 private-home transactions from 1995 to June 2026 found a median annualised gross return of 3.7% for homes bought on the resale market, against 2.7% for homes bought new and held for at least three years. These figures measure realised price changes, before costs and income.
The new-home premium starts on day one
A brand-new home offers attractions that do not appear in a return calculation: untouched fittings, contemporary facilities and the pleasure of choosing a unit directly from the developer. The financial trade-off is that buyers may pay substantially more for those qualities.
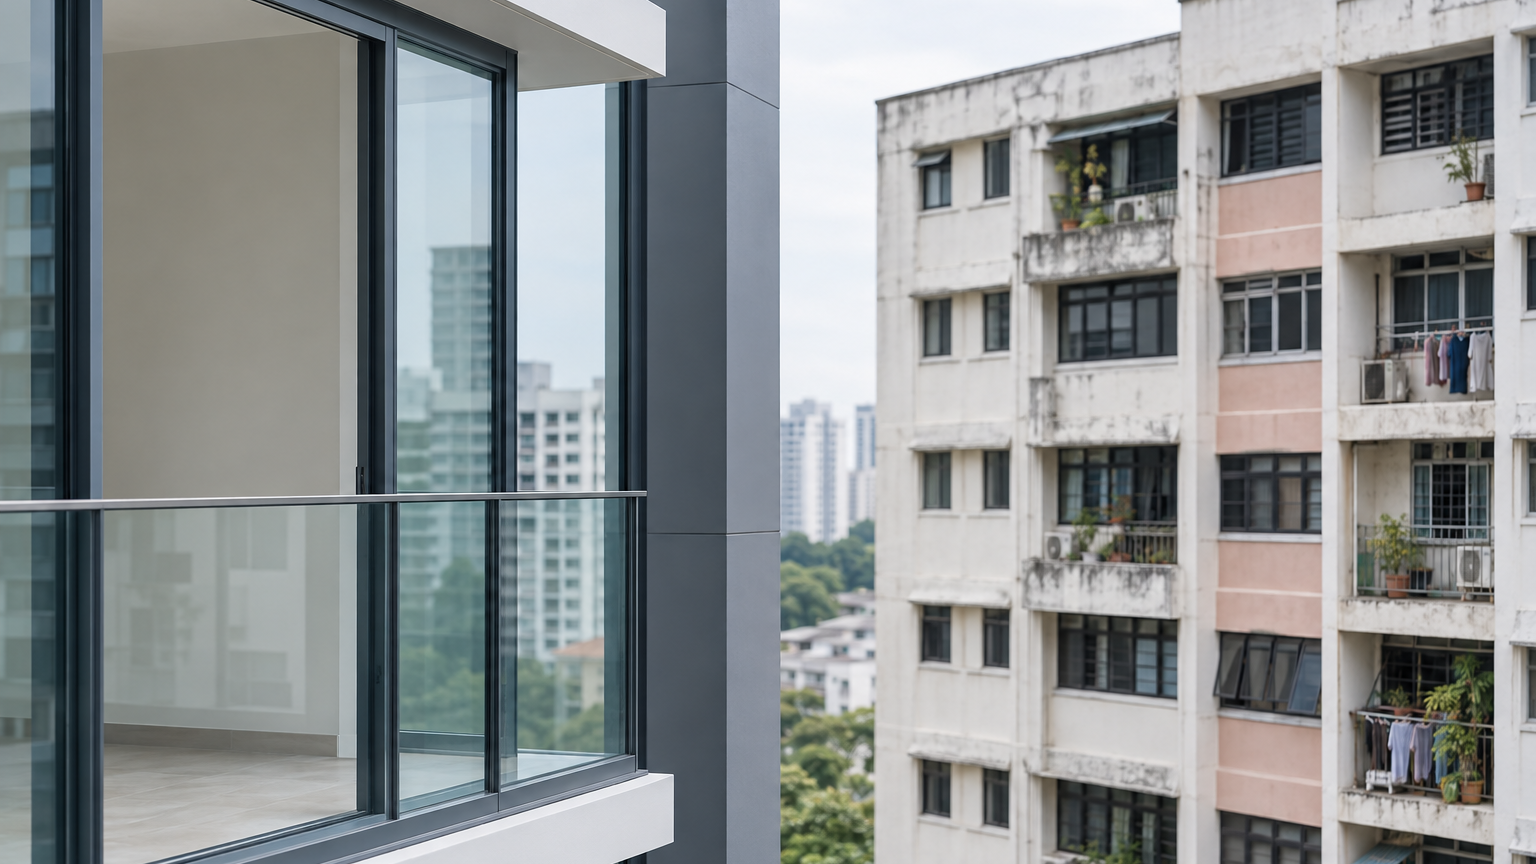
Over the past five years covered by the analysis, new homes reportedly commanded per-square-foot premiums of 41% in the Core Central Region, 48% in the Rest of Central Region and 50% in the Outside Central Region compared with resale homes. These are Singapore’s three broad private-housing regions, moving from the central area to the city fringe and then the suburban market.
Those regional figures are not valuations of identical homes. New and resale projects can differ in age, tenure, location, design and facilities. Still, they illustrate the hurdle created by a high entry price.
Suppose a resale unit costs S$1 million and a broadly comparable new unit costs 50% more, or S$1.5 million. If both rise by 10%, they reach S$1.1 million and S$1.65 million respectively. Both owners have the same percentage gain, but the new-home owner needs a future buyer willing to support a selling price that is S$550,000 higher.
The risk appears when the premium for being new fades. Once both developments are occupied resale properties, later buyers may compare them more closely on practical qualities such as layout, upkeep, accessibility and remaining lease. The first owner’s purchase price does not disappear from their own break-even calculation, even if the next buyer values the home differently.
A one-point gap compounds over time
An annualised return converts the total price change over a holding period into an average compounded yearly rate. It makes homes held for different lengths of time easier to compare.
Applying the reported median rates to a simple illustration, S$1 million growing at 3.7% annually becomes about S$1.20 million after five years. At 2.7%, it becomes roughly S$1.14 million. The difference is around S$55,000 before allowing for the costs of buying, holding and selling.
That is only an illustration of compounding, not a forecast for either home. The reported returns exclude stamp duties, legal and agent fees, mortgage interest, maintenance, renovation, property tax, rental income and inflation. They also cover homes that were sold again, rather than every private home still held by its owner.
For the Holland Village buyer, breaking even on the sale price would therefore not mean recovering every dollar spent. His personal break-even point would also reflect his original transaction costs, financing expenses and the cost of selling.
Where the transaction evidence comes from
Singapore’s official private residential transaction search is maintained by the Urban Redevelopment Authority. Its resale and sub-sale records are based on caveats lodged with the Singapore Land Authority, giving buyers a way to search recorded deals by development, property type, tenure and transaction date.
A public government dataset also makes private residential transaction information available for reuse. It includes transaction details that can support broader analysis rather than relying only on advertised asking prices.
Researchers commonly use repeat sales—successive recorded transactions involving the same property—to study how prices changed between purchases. This helps reduce the difficulty of comparing two homes that may look similar on paper but differ in floor, facing, layout or condition.
Academic work using Singapore housing records shows how large transaction datasets can be organised for empirical study. That work is separate from the 630,000-transaction analysis reported here, but it illustrates why careful matching and classification matter when turning caveats into return estimates.
The official transaction search is most useful at the individual-home level. A buyer can examine recent caveats for the same development and floor-area band, then compare them with nearby projects sharing a similar tenure and completion period.
Resale did not lead in every category
The overall median hides meaningful variation. Resale homes between 700 and 1,000 sq ft led by as much as 12.4 percentage points in parts of the analysis, while leasehold homes larger than 1,500 sq ft that were bought new recorded stronger average returns than comparable resales over the past two years. The full dataset and detailed methodology were not publicly available for independent replication, so these findings should remain attributed to the reported study rather than treated as official URA results.
That variation matters because “new” and “resale” are only starting labels. A well-priced new home can outperform an expensive resale, while an older unit bought cheaply can still disappoint if its layout, condition or lease deters future buyers.
The immediate market was still moving while this historical comparison emerged. URA’s third-quarter 2026 flash estimate showed private residential prices rising 1.4% from the previous quarter, while sale volume was about 30% lower than in the second quarter.
For the owner near Holland Village, however, the national quarterly index will not settle the question. His outcome will depend on what similar two-bedroom homes command when his family is ready to move—and whether that price clears the S$2.1 million starting point plus the costs accumulated along the way.