 plan
Singapore private rents rise 1.3% in Q3 2026, led by landed homes
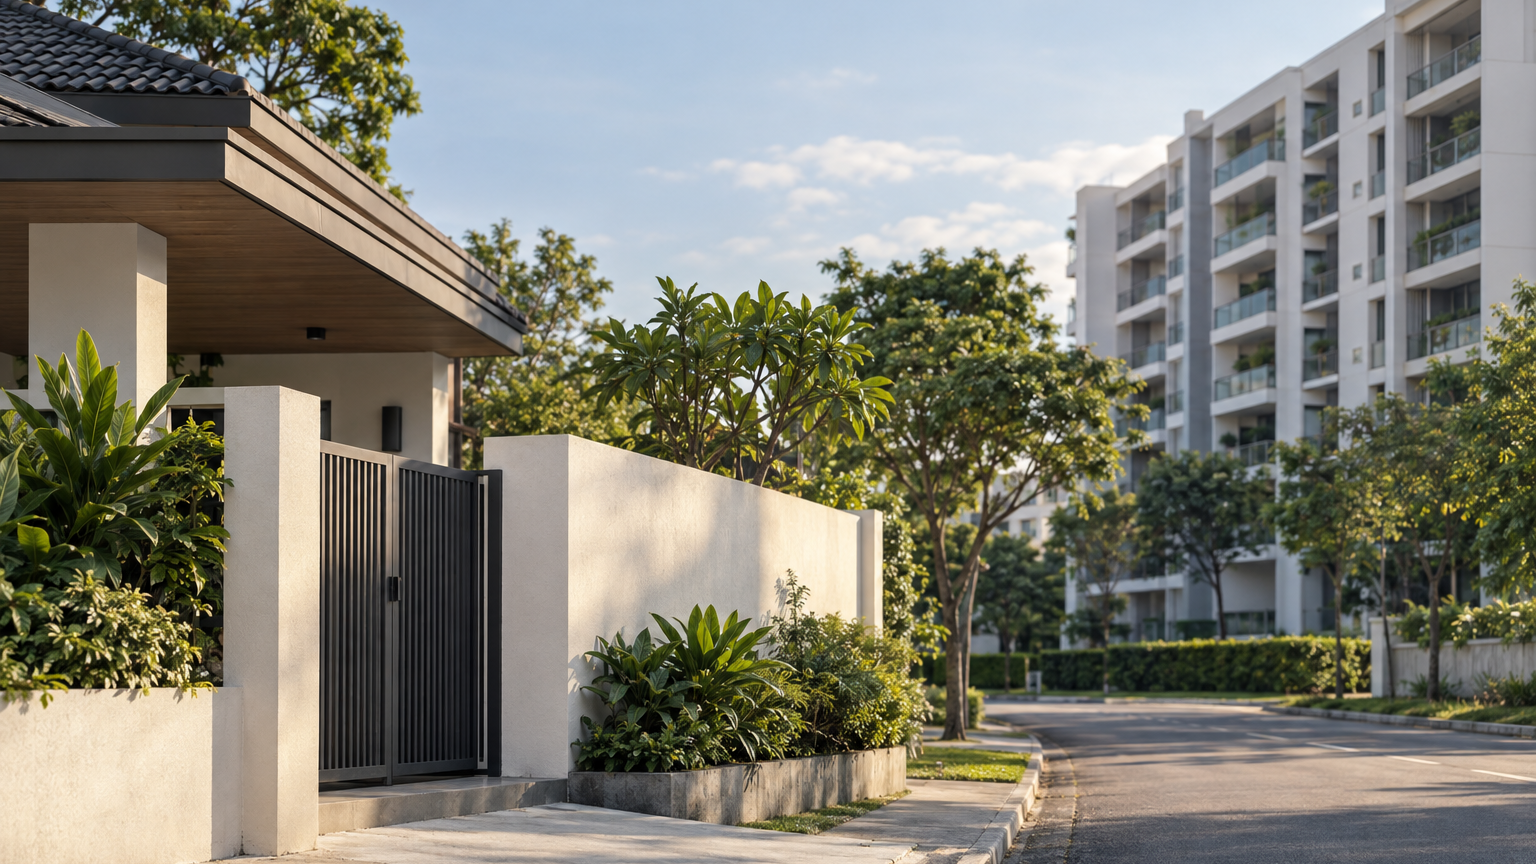
Landed rents increased 2.1%, versus 1.2% for non-landed homes. For lease renewals, compare recent local leases before applying the national trend.
Singapore’s private-home rental index rose 1.3% in the third quarter of 2026, with landed homes recording a larger quarterly increase than non-landed properties. The overall index climbed from 162.5 to 164.6 in the Urban Redevelopment Authority’s series, published in SingStat table M212311 and updated on 23 October 2026.
For an owner approaching a lease renewal, that provides a useful market backdrop: both property categories recorded increases. Landed rents rose a calculated 2.1%, against 1.2% for non-landed homes. Those broad movements give the direction of the market, but the table’s property-type indices do not establish the recent rents achieved for a particular development or home.
Landed rose faster, but the index is not a rent bill
The quarterly comparison is straightforward. The figures below are index levels, based on the first quarter of 2009 equalling 100; the percentage changes are calculated from the published levels and rounded to one decimal place.
| Property category | Q2 2026 index | Q3 2026 index | Calculated quarterly change |
|---|---|---|---|
| All private residential properties | 162.5 | 164.6 | +1.3% |
| Landed | 156.4 | 159.7 | +2.1% |
| Non-landed | 162.5 | 164.5 | +1.2% |
The figures are from URA’s rental-index series in SingStat table M212311.
For example, the overall index increased by 2.1 index points. Dividing that increase by its Q2 starting level of 162.5, then multiplying by 100, gives approximately 1.3%. An index-point increase and a percentage increase are different measurements.
The longer view adds useful context. From Q4 2025 through Q3 2026, all three series rose in each successive quarter. Landed moved from 152.1 to 159.7 over that window, while non-landed moved from 161.3 to 164.5. The Q3 result therefore extends a rising path during 2026 rather than standing alone as an isolated quarterly increase.
The non-landed index’s higher numerical level is not evidence that a non-landed home costs more to rent than a landed one. These are measures of rental movement against a base period, not monthly dollar rents.
- Rental Index Of Residential Properties
- Landed
- Non-Landed
Broad private-residential rental indices with 1st Quarter 2009 = 100. The selected observations are consecutive quarters, not annual averages. Since Q1 2015, the method controls for property attributes and aggregates movements using five-quarter fixed weights. These series do not establish district, project or individual-unit rents, vacancy or causes of rental movements; the retained metadata does not specify an adjustment type.
What the index adjusts for—and what it leaves unanswered
Since Q1 2015, the rental indices have used stratified hedonic regression. In everyday terms, the method accounts for differences in transacted homes’ characteristics, including age and unit size, rather than simply comparing an unadjusted average rent between quarters.
Rental movements are then combined using five-quarter fixed weights. The underlying rental data comes from the Inland Revenue Authority of Singapore. The series is therefore a structured measure of rental movement, rather than a collection of current asking rents.
Its coverage is also the boundary of its usefulness here. The retained table provides aggregate, landed and non-landed series, not district-, project- or unit-level results, lease terms or vacancy figures. The captured metadata does not specify an adjustment type, so this comparison should not be labelled seasonally adjusted.
For a renewal decision, our recommendation is to use the index to frame the market conversation, then move to evidence closer to the home. The next question is what a genuinely comparable property has recently leased for.
Build the renewal comparison around the actual home
Start with recent completed leases in the same project where those are available. For a landed home, or where same-project evidence is sparse, look for closely comparable properties nearby. Keep advertised asking rents separate from agreed rents when assembling the comparison.
Then check whether the comparison is fair. Consider size, age, condition, furnishing, floor level where relevant, and the proposed lease term. Avoid treating a broadly similar address as a close match without checking the homes and contractual commitments.
A useful comparison sheet should put the existing lease, the proposed renewal and the best available alternatives side by side. Record the monthly rent and lease length, note meaningful unit differences, and flag how recent each comparable lease is. Where the evidence is thin, keep that uncertainty visible rather than producing an overly precise target.
Our recommendation is to treat local comparable leases as the pricing evidence, with the national index as supporting context. Use those comparisons to test a renewal proposal rather than automatically applying the quarterly percentage change to the current rent.
Compare a renewal with the cost of starting again
For an owner, assess more than the two monthly rental figures. Compare a renewal with the existing tenant against a new letting, allowing for its timing and costs. Before rejecting a renewal, examine competing available homes, likely vacancy and any work needed before another tenant can move in.
For a tenant, make the equivalent comparison: weigh the proposed renewal against credible alternatives, then account for moving costs, setup work and the inconvenience of changing homes. Keep those practical costs separate from the rent comparison so neither side gets lost.
The Q3 figures establish the broad direction: private rents rose, and landed recorded the faster quarterly gain. The next lease decision needs a narrower answer—whether the proposed rent fits this home, its terms and the alternatives available now.