 plan
Singapore industrial rents rise again, even as more space sits empty
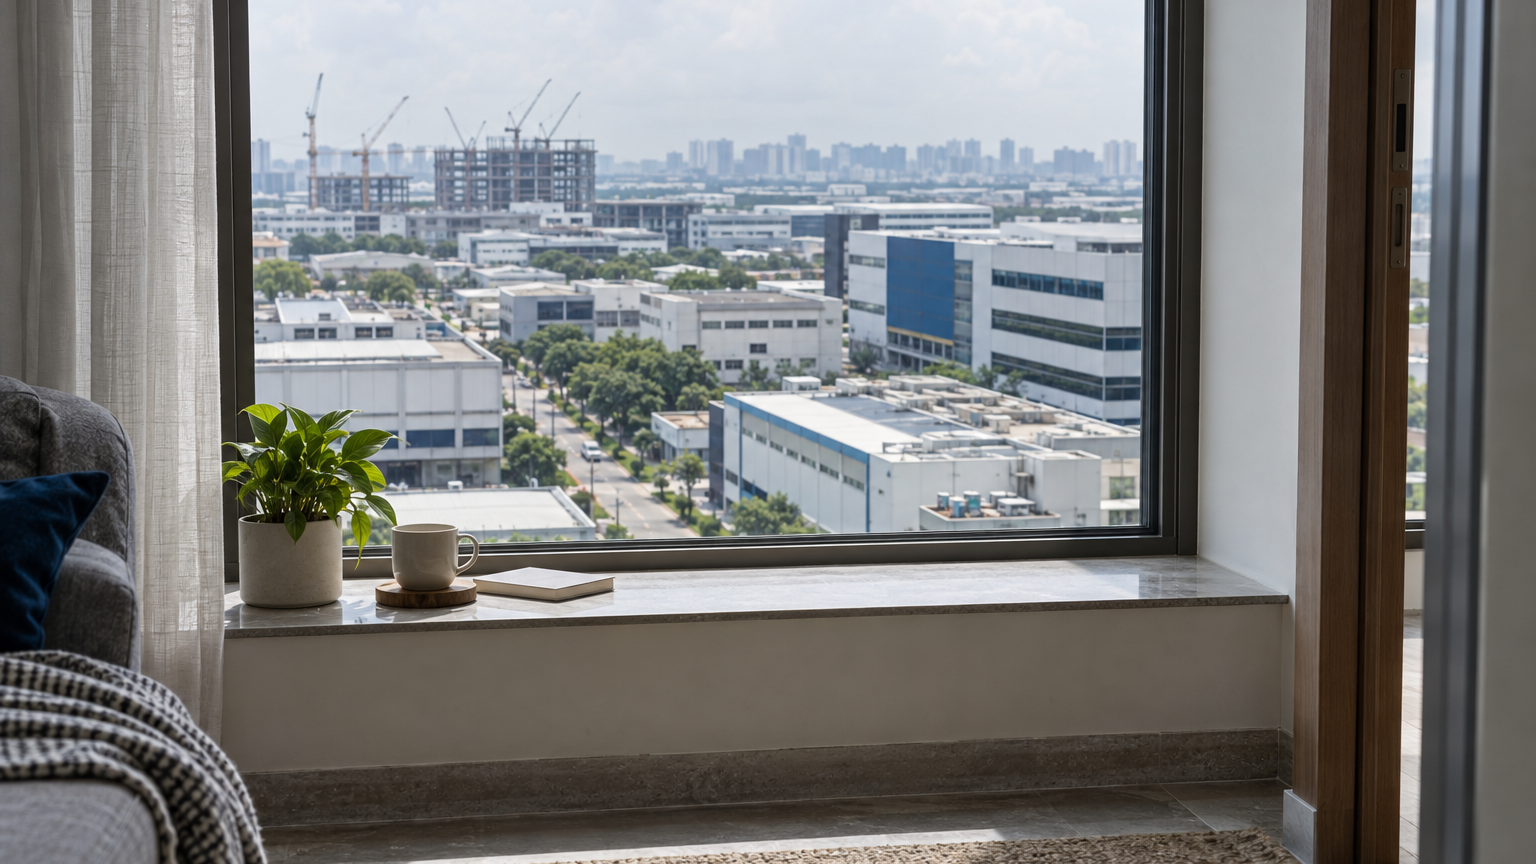
JTC’s third-quarter 2026 figures reveal an uneven market: AI-linked manufacturing supports specialised facilities, while older factories and suburban business parks face softer demand.
Singapore’s industrial rents rose for a 24th consecutive quarter in July–September 2026, yet more space stood empty. JTC Corporation’s figures, released on 22 October, showed rents increasing 0.5% from the previous quarter while overall occupancy slipped 0.2 percentage point to 88.9%. Industrial property prices rose 1.0% over the same period.
The revealing detail is where demand is holding up. Semiconductor and AI-related activity supported specialised industrial facilities, while older factories and suburban business parks faced softer conditions. For businesses paying rent—and owners collecting it—the islandwide increase describes a market moving at different speeds, rather than a shared improvement across every building.
How can rents rise while occupancy falls?
Rent and occupancy answer different questions. The rental index tracks changes in rental levels; occupancy measures how much available space is occupied. In the third quarter, those measures moved in opposite directions: rental levels increased even as the occupied share of industrial space declined.
The size of the occupancy change is worth keeping in proportion. A decline of 0.2 percentage point means occupancy moved from 89.1% to 88.9%. Put another way, the unoccupied share increased from 10.9% to 11.1%—a modest deterioration, rather than a sudden wave of empty factories. These are calculations from JTC’s reported figures.
Contemporaneous reporting linked the softer occupancy to tenants moving out of older factories marked for redevelopment, as well as weaker demand at suburban business parks. That matters because space emptied ahead of redevelopment tells a different story from a modern facility struggling to attract an occupier. Both can weigh on the headline occupancy figure, but the underlying circumstances differ.
The useful reading is therefore not that rents and occupancy contradict each other. It is that the aggregate figures combine buildings with different prospects. The reported weakness in older premises can sit alongside continued demand for more specialised space.
Where does AI actually enter the picture?
The clearest supporting evidence comes from the high-tech industrial segment. Cushman & Wakefield reported that rents for this category rose 0.3% quarter on quarter, while vacancy fell to 13.5%, supported by semiconductor and AI-related firms. Within that segment, rents and occupancy conditions strengthened together.
For a property reader, the connection is more concrete than the phrase “AI demand” might suggest. The reported support runs through semiconductor and related industrial activity: the physical businesses serving a technology investment cycle. It is not evidence that AI companies are broadly taking up ordinary factory units throughout Singapore.
There is also an important distinction between the two sets of numbers. Cushman & Wakefield’s high-tech category is a specialist market measure, while JTC’s all-industrial figures describe the broader market. They provide complementary views, but the high-tech vacancy rate should not be treated as a directly interchangeable version of JTC’s islandwide occupancy figure.
AI is a supported demand backdrop, not a measured share of all industrial leasing. The available evidence does not put a percentage on its contribution to JTC’s overall rental increase. Its value here is in helping explain why particular facilities can remain sought after while other industrial premises lose tenants.
Warehouses and business parks tell different stories
The split is visible beyond high-tech facilities. Warehouse rents increased 1.0% in the third quarter, compared with just 0.1% for business parks. Warehouse occupancy stood at 89.7%, while business-park occupancy was 77.2%.
That is a 12.5-percentage-point occupancy gap, calculated from the reported figures. Expressed as empty space, warehouses had an unoccupied share of 10.3%, against 22.8% for business parks. The latter was more than twice the former—a much clearer picture of the difference than the small positive rental movements alone.
These figures also show why the AI explanation should stay attached to the evidence that supports it. Warehouse rents recorded a larger quarterly increase than the high-tech rental measure, but that comparison does not identify the source of warehouse demand. The specialist report supports an AI-related explanation for high-tech conditions; it does not assign the warehouse increase to the same cause.
For someone reading an industrial landlord’s results or considering premises for a business, the category therefore matters. A business park with substantial vacant space faces a different competitive setting from a warehouse market with much higher occupancy. The islandwide rent increase alone leaves that distinction hidden. This is an interpretation of the reported segment figures.
What does the six-year rental streak tell us?
The latest increase extended the rental recovery from the third-quarter 2020 trough to 24 consecutive quarters. Compared with a year earlier, industrial rents were 2.1% higher and prices were 4.2% higher in the third quarter of 2026.
The duration is striking, but it answers a narrower question than it first appears to. It establishes a sustained rise in the overall rental index—not an identical experience for every tenant or landlord. The latest quarter itself illustrates that distinction: business-park rents barely increased, warehouse rents rose faster, and overall occupancy eased.
Prices and rents also moved by different amounts. The annual price increase was twice the annual rental increase, based on the reported 4.2% and 2.1% figures. That comparison describes the pace of change; it is not a rental yield calculation, which would require actual property prices and rental income rather than two index growth rates.
Will incoming supply change the balance?
JTC expected around 300,000 sq m of industrial space to be completed in the fourth quarter of 2026. Further out, projected completions averaged 1.2 million sq m a year from 2027 to 2030. These were expected additions, not confirmation that the space had already been delivered.
On a simple calculation, the four-year projection amounts to about 4.8 million sq m. But a total area does not tell readers how much new space will compete with a particular existing factory, warehouse or business park. The available evidence does not establish that competitive breakdown.
That is the next consequential question: not just how much industrial space arrives, but whether it matches the businesses seeking premises. The third-quarter evidence already shows specialised facilities holding up better alongside weaker older factories and suburban business parks. Incoming supply will enter that uneven market—not one in which every industrial landlord enjoys the same demand.