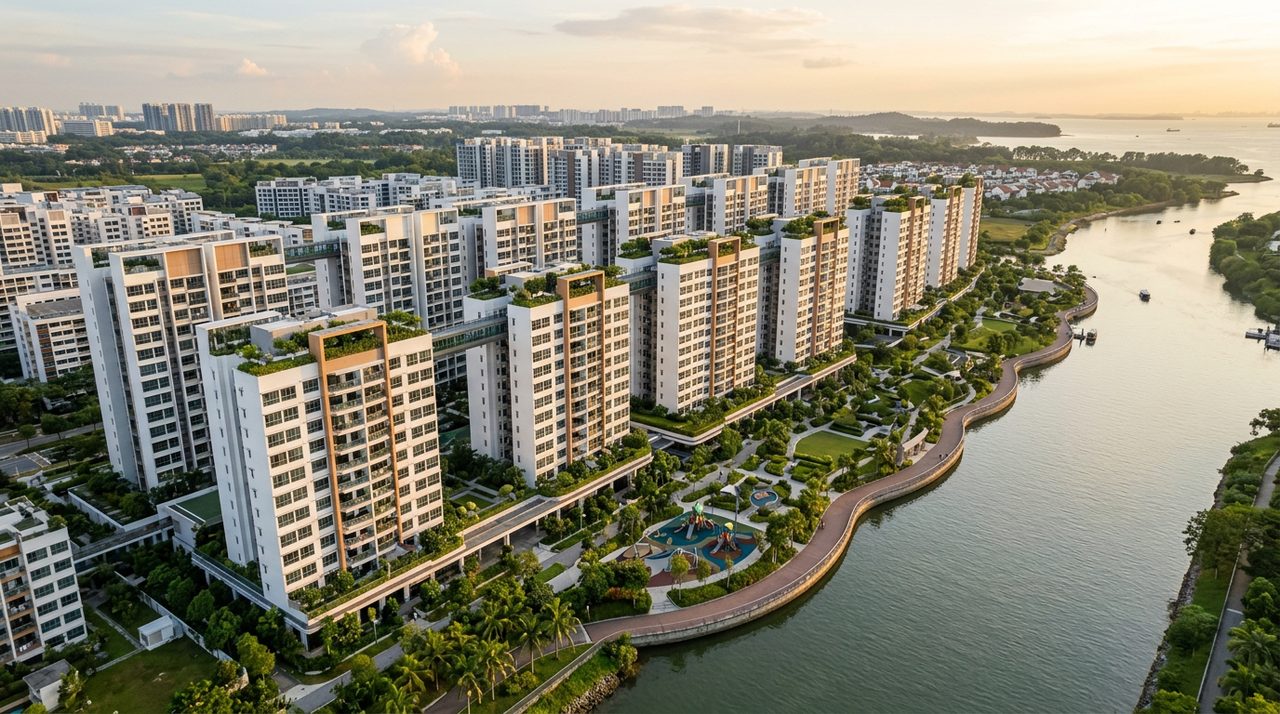
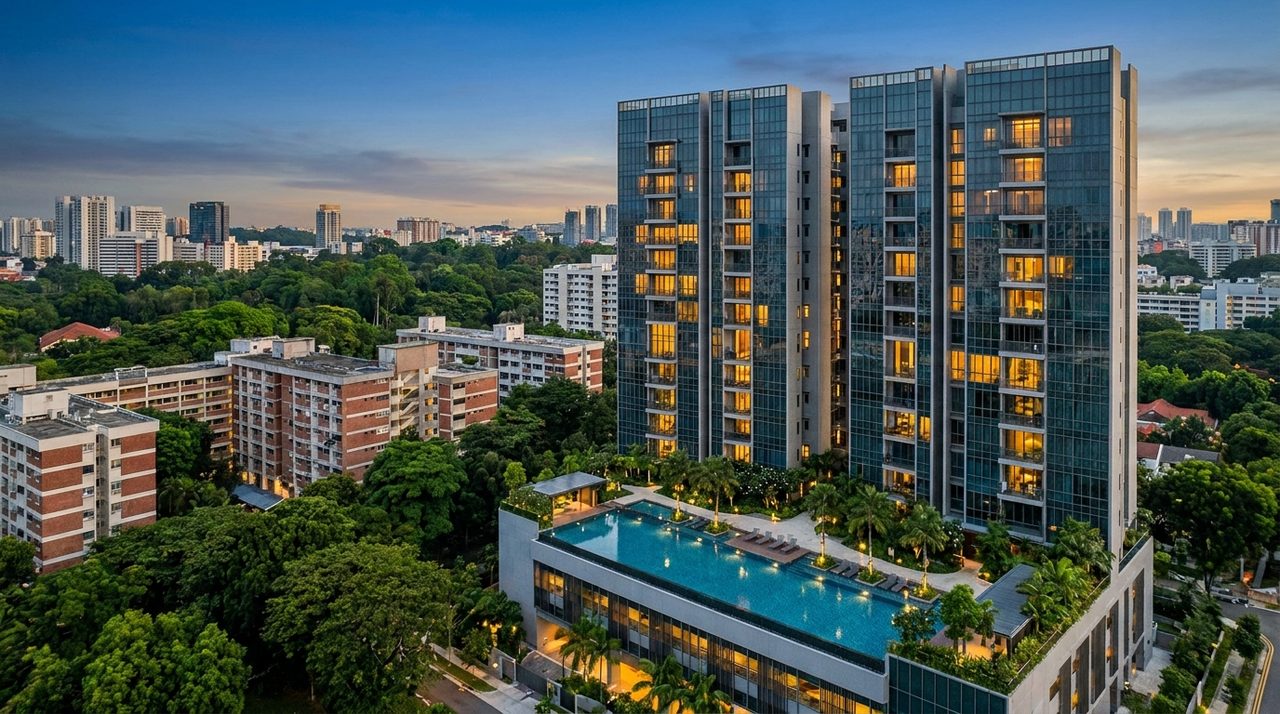
 plan
Q3 2026: Outside Central Region leads non-landed private home price growth
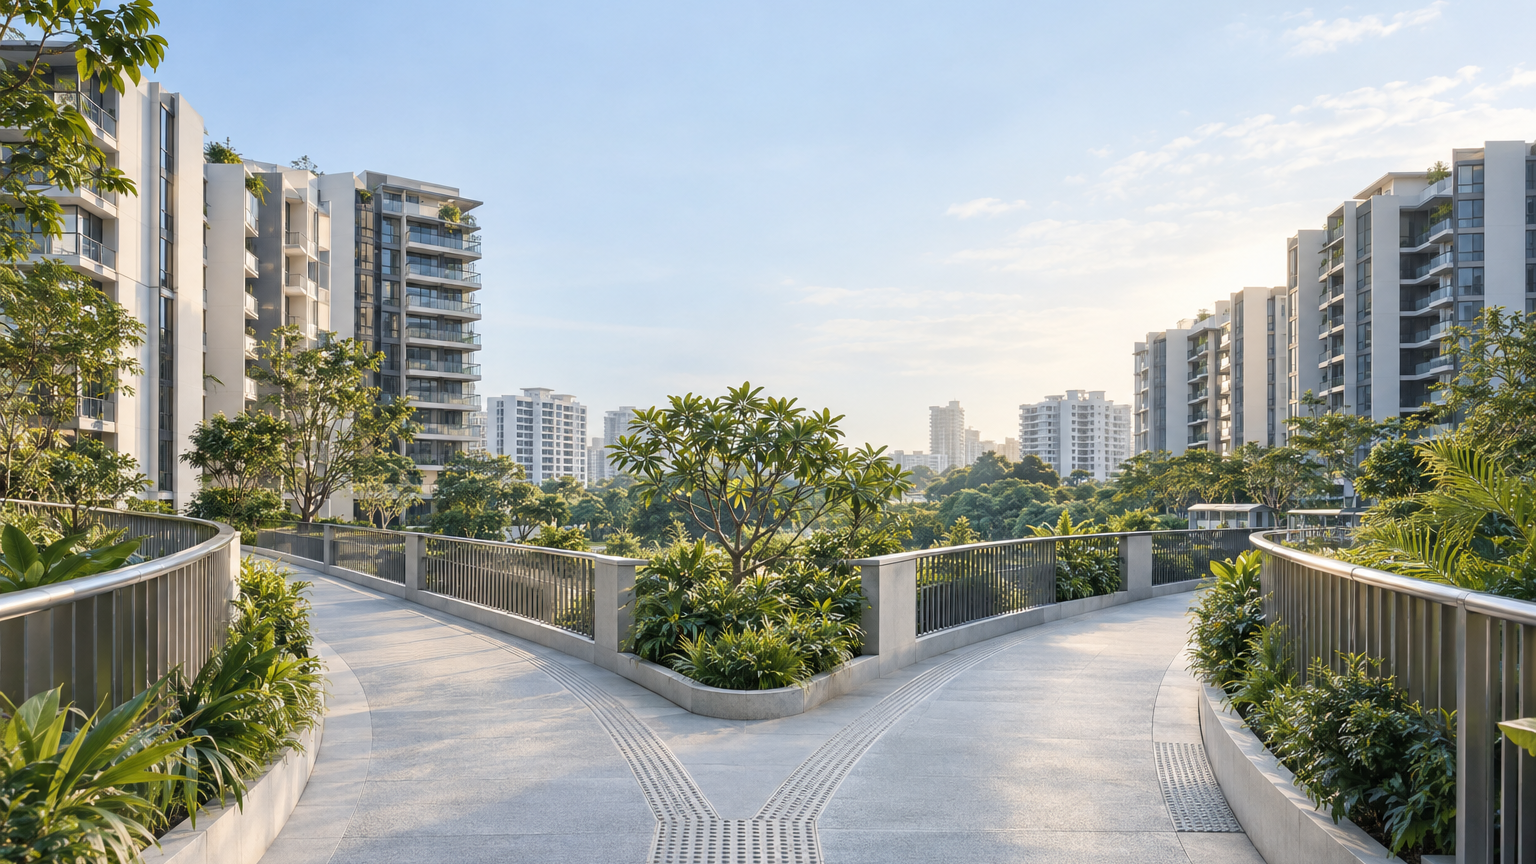
OCR rose 2.3%, CCR edged up 0.3% and RCR stayed flat. The official indices show different regional paths—not which particular home offers better value.
Singapore’s non-landed private home price indices took different paths in Q3 2026: Outside Central Region (OCR) rose 2.3%, Core Central Region (CCR) edged up 0.3%, and Rest Of Central Region (RCR) was unchanged. Those changes are calculated from the official URA regional series published through SingStat, comparing Q2 with Q3 2026.
For someone choosing between homes in different regions, the useful finding is the contrast: the strongest quarterly price movement was in OCR, while RCR stood still. That gives a buyer context for comparing locations—but the figures measure regional movements, not the price difference between the homes on their shortlist.
What changed between Q2 and Q3?
The official table was updated on 23 October 2026. This is a look back at its Q3 observations, rather than a fresh-release announcement. The series is titled Price Index Of Non-Landed Private Residential Properties By Locality, with the first quarter of 2009 set to 100.
| Official regional series | Q2 2026 index | Q3 2026 index | Quarter-on-quarter change |
|---|---|---|---|
| Core Central Region | 161.5 | 162.0 | +0.3% |
| Rest Of Central Region | 226.2 | 226.2 | 0.0% |
| Outside Central Region | 271.1 | 277.3 | +2.3% |
Index levels are from the official table; percentage changes are calculated from those published levels and rounded to one decimal place.
OCR’s increase was 6.2 index points, compared with CCR’s 0.5 point. RCR recorded no change at the published precision. In percentage terms, OCR’s quarterly increase exceeded CCR’s by approximately 2.0 percentage points. That is a comparison of growth rates, not a dollar premium between locations.
The distinction matters because the starting levels differ. For OCR, the calculation is `(277.3 − 271.1) ÷ 271.1 × 100`, giving approximately 2.3%. Simply calling the 6.2-point increase “6.2%” would substantially overstate the movement.
Was Q3 a continuation of the previous quarter?
Not across all three regions. Looking one observation further back shows why Q3 is better described as a regional split than a uniform acceleration.
OCR’s index slipped from 271.4 in Q1 2026 to 271.1 in Q2, before rising to 277.3 in Q3. Its strongest movement in this three-quarter window therefore came after a small decline.
RCR followed a different path: 228.9 in Q1, then 226.2 in Q2, and 226.2 again in Q3. A flat third quarter meant it held its Q2 level; it did not reverse the preceding fall.
CCR rose in both observed intervals, from 158.6 to 161.5, then to 162.0. Its Q3 increase was smaller than its Q2 increase. Together, these paths show a rebound in OCR, a pause after a decline in RCR, and a slower rise in CCR. Those are descriptions of the published series, rather than explanations of what caused them.
For a buyer, the extra quarter changes the reading. “Flat in Q3” and “rising in Q3” are useful summaries, but neither tells the full recent direction on its own. Here, the sequence is more informative than treating each latest percentage as a standalone verdict.
What exactly does this index measure?
URA’s methodology says that, from Q1 2015, the private residential price indices use stratified hedonic regression. In everyday terms, the method controls for differences in attributes such as the age and size of properties transacted, rather than simply comparing unadjusted average sale prices. Price movements are then combined using five-quarter fixed weights.
The underlying information comes from caveats lodged with the Singapore Land Authority, stamp-duty data from the Inland Revenue Authority of Singapore, and data supplied by developers. This is a statistical measure assembled from transaction information, not an asking-price survey.
The index levels also need careful reading. OCR’s 277.3 and CCR’s 162.0 are measured against the same historical base convention, but they are not dollar prices or comparable prices per square foot. The higher OCR reading does not establish that an OCR home costs more than a CCR home; the useful comparison here is how each regional series changed over the same quarter.
Should the regional split change a purchase shortlist?
A practical question is whether OCR’s stronger rise makes an RCR alternative better value. This table supplies the regional movement, not the matched purchase comparison. It contains no separate rows for new launches, resale-only homes, individual projects or unit layouts, so its percentages cannot settle that choice.
A useful next comparison would put actual alternatives side by side: achieved transaction prices, tenure, age, size, layout and sale type. The aim would be to establish what the buyer would pay for the particular homes, rather than substituting a regional growth rate for a property price.
The same discipline applies to sellers. Applying OCR’s 2.3% mechanically to an individual home would turn an aggregate, quality-adjusted measure into a property valuation it was not designed to provide.
The clearest conclusion is narrower—and more useful: Q3 2026 brought a sizeable OCR increase, a small CCR increase and no published RCR movement in non-landed private home prices. That regional divergence is worth knowing before comparing homes. Which specific home offers the stronger proposition remains a transaction-level question.