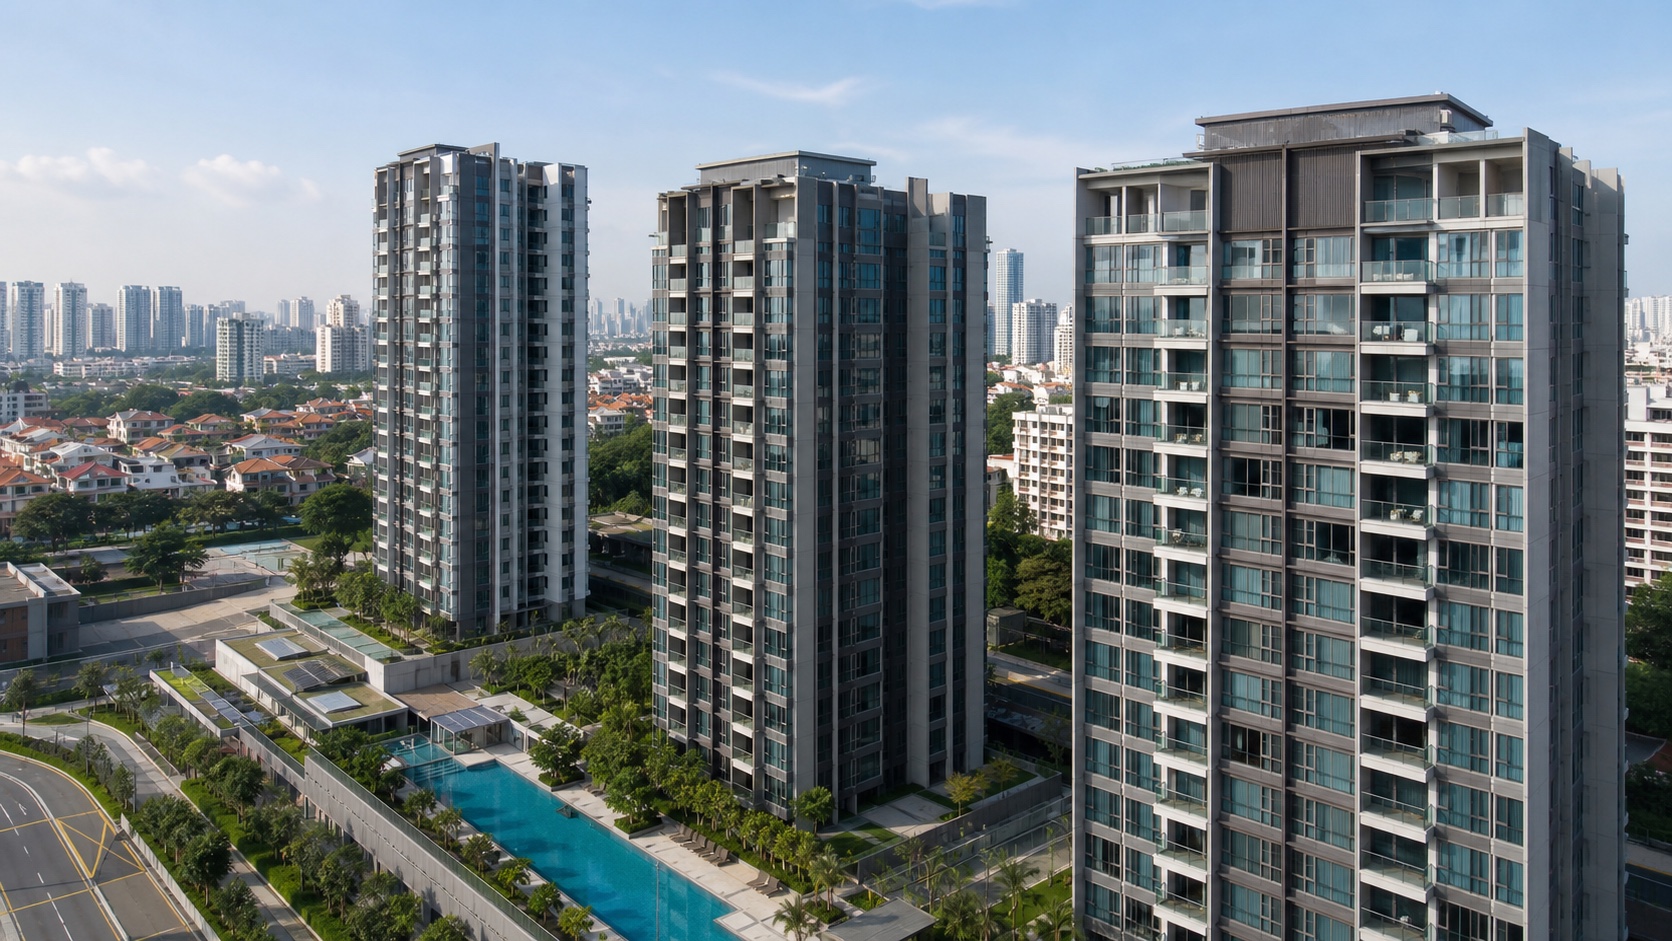
 plan
Private-home prices rose 1.4% as new-home sales nearly halved
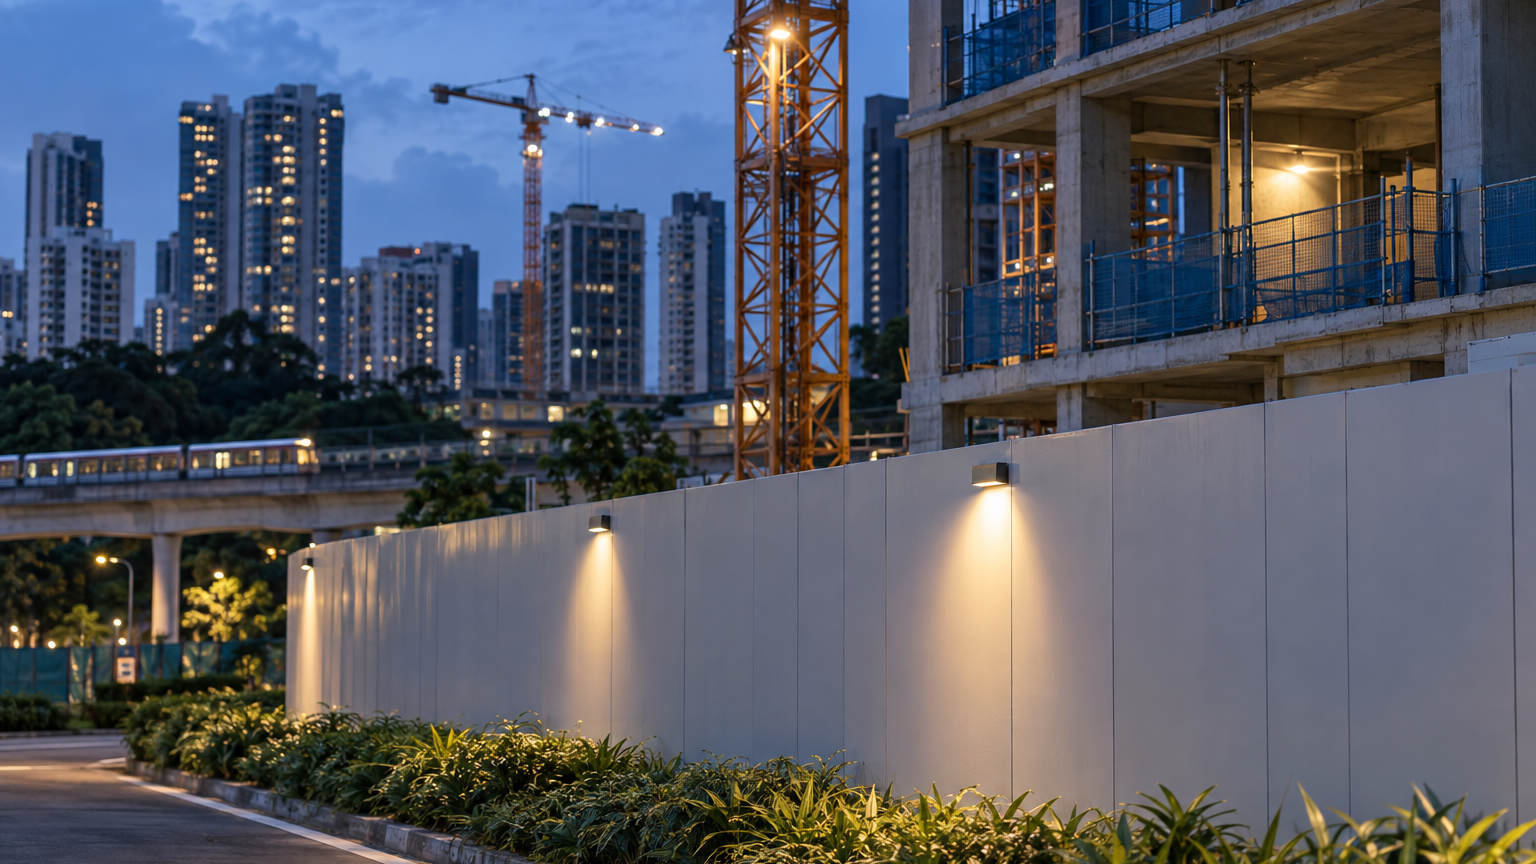
Thomson Reserve’s scheduled October 31 launch brings 1,268 units into the outlook. Its sales response will help show whether a quieter quarter gives way to stronger buying.
Singapore’s private-home prices rose 1.4% in the third quarter of 2026, even as developers sold 1,183 new homes, down from 2,141 in the previous quarter. The figures, released by the Urban Redevelopment Authority (URA) on October 23, leave buyers with an apparently awkward combination: fewer purchases, but faster price growth.
The next major event is more concrete than a forecast. Thomson Reserve, a 1,268-unit development at Bright Hill Drive in Upper Thomson, is scheduled to begin sales on October 31. For buyers weighing a new launch against other options, its actual sales response will offer fresh evidence after a quarter in which developers brought considerably fewer homes to market.
What changed in Q3?
URA’s private residential price index rose 1.4% quarter-on-quarter, following a 0.5% increase in Q2. That brought cumulative price growth over the first nine months of 2026 to 2.8%. The index describes the broad private residential market; it is not a valuation adjustment to apply to every individual home.
Developer sales moved in the opposite direction. The 1,183 uncompleted private homes sold in Q3, excluding executive condominiums, represented a 44.7% decline from Q2. That percentage is calculated from URA’s reported quarterly totals of 1,183 and 2,141 homes.
But buyers also had fewer newly launched units to consider. Developers launched 1,140 uncompleted private homes, excluding executive condominiums, compared with 1,783 in Q2—a decline of about 36.1%, calculated from the official figures. Both the flow of new launches and the number of purchases fell sharply.
That distinction matters. A sales count answers how many homes changed hands within a particular category. A price index answers a different question about price movements across the market. Here, the developer-sales figures cover uncompleted private homes excluding executive condominiums, while the headline price index covers the wider private residential market. They are not two measurements of exactly the same basket.
Why could sales fall while prices rose?
The simplest explanation starts with the launch calendar. Q3 brought fewer newly launched units, giving buyers a smaller fresh selection than in Q2. That helps explain why a lower sales total need not be accompanied by a lower price index.
CBRE’s October 23 commentary identifies three factors behind the new-home slowdown: fewer launches, high launch prices and demand settling after strong sales in 2025. This is the research firm’s interpretation of the results, rather than an additional official finding from URA.
Those explanations can sit together. Fewer launches can limit purchasing opportunities, while higher prices can make the available choices harder to accept. A buyer may still want a home but decline the particular combination of location, layout and price on offer. The quarterly totals do not separate those individual decisions; CBRE’s assessment offers an explanation for the aggregate slowdown.
There is also a useful detail in the numbers: developers sold 43 more homes than they launched during Q3. That is the difference between 1,183 sales and 1,140 launches. The two totals should therefore not be treated as a single batch of newly released homes, or divided to produce a launch take-up rate.
For someone following the market, the practical reading is narrower than either “buyers have disappeared” or “prices can only rise”. Q3 recorded fewer developer sales alongside stronger market-wide price growth. Understanding the next quarter requires looking at what becomes available, as well as what buyers actually purchase.
Why Thomson Reserve matters to the Q4 outlook
Thomson Reserve is a 99-year leasehold development jointly unveiled by UOL Group and CapitaLand Development. Its public preview began on October 17, ahead of the scheduled October 31 sales launch. These dates distinguish the opportunity to view the project from the point at which its sales response can begin to be assessed.
Its scale makes it particularly relevant after Q3’s thin launch calendar. At 1,268 units, the entire development contains 128 more homes than developers launched across Singapore during Q3, based on a comparison with URA’s 1,140-unit total. That is a comparison of project size with quarterly launches—not a claim that all 1,268 units will be released or sold at once.
CBRE expects Q4 sales momentum to improve, led by Thomson Reserve, and forecasts 7,500–8,000 new-home sales for 2026. Its explanation is that the project could give pent-up demand somewhere to go after the quieter launch quarter.
That is the basis of the recovery story: a substantial new buying opportunity arriving after fewer launches, rather than a rebound already recorded in the official figures. As at October 25, Q4 recovery remained a forecast, and Thomson Reserve’s scheduled sales launch was still ahead.
The useful follow-up is consequently the number of homes released, the number purchased and the prices attached to those purchases. Those details would help distinguish an appealing project at an acceptable price from a broader increase in buyers’ willingness to spend. That is an interpretation to assess against the eventual results, not a conclusion available from the preview timetable.
Does incoming supply change the picture?
There is more supply beyond this one development. The government said the second-half 2026 Confirmed List could provide 4,745 private homes, taking the full-year Confirmed List total to 9,320 units. It also said more than 32,000 private homes, including executive condominiums, could be made available over the following one to two years.
Those figures describe a supply pipeline, whereas the Q3 statistics record launches and sales during a completed quarter. Keeping the timelines separate avoids treating future availability as though it were already a choice on a buyer’s shortlist today.
For a household comparing homes, the useful question is how that pipeline eventually translates into suitable alternatives. A market-wide supply total cannot answer whether a particular future home will meet that household’s needs. Equally, one large launch offers only part of the evidence needed to assess the wider market.
What would make a recovery convincing?
The first piece of evidence will be whether the additional choice attracts purchases. The second will be whether activity continues beyond the initial launch period. Reading sales volumes alongside launch volumes would make the comparison with Q3 more informative than looking at either figure alone. This follows from the sharp falls in both measures during the quarter.
Price evidence should be kept alongside those sales results, rather than assumed from them. Q3 itself shows why: the market-wide index rose faster even while developer sales fell. A busier Q4 and further price growth are separate propositions, and CBRE’s expectation of improved momentum remains an analyst forecast.
For now, the clearest change ahead is in the buying opportunities available. Thomson Reserve’s scheduled October 31 launch brings a development larger than the entire preceding quarter’s launch volume into the picture. Whether buyers commit—and at what prices—is the next consequential result, not something the Q3 index has already settled.