 plan
New private-home sales fall 45% as resale holds steady in Q3
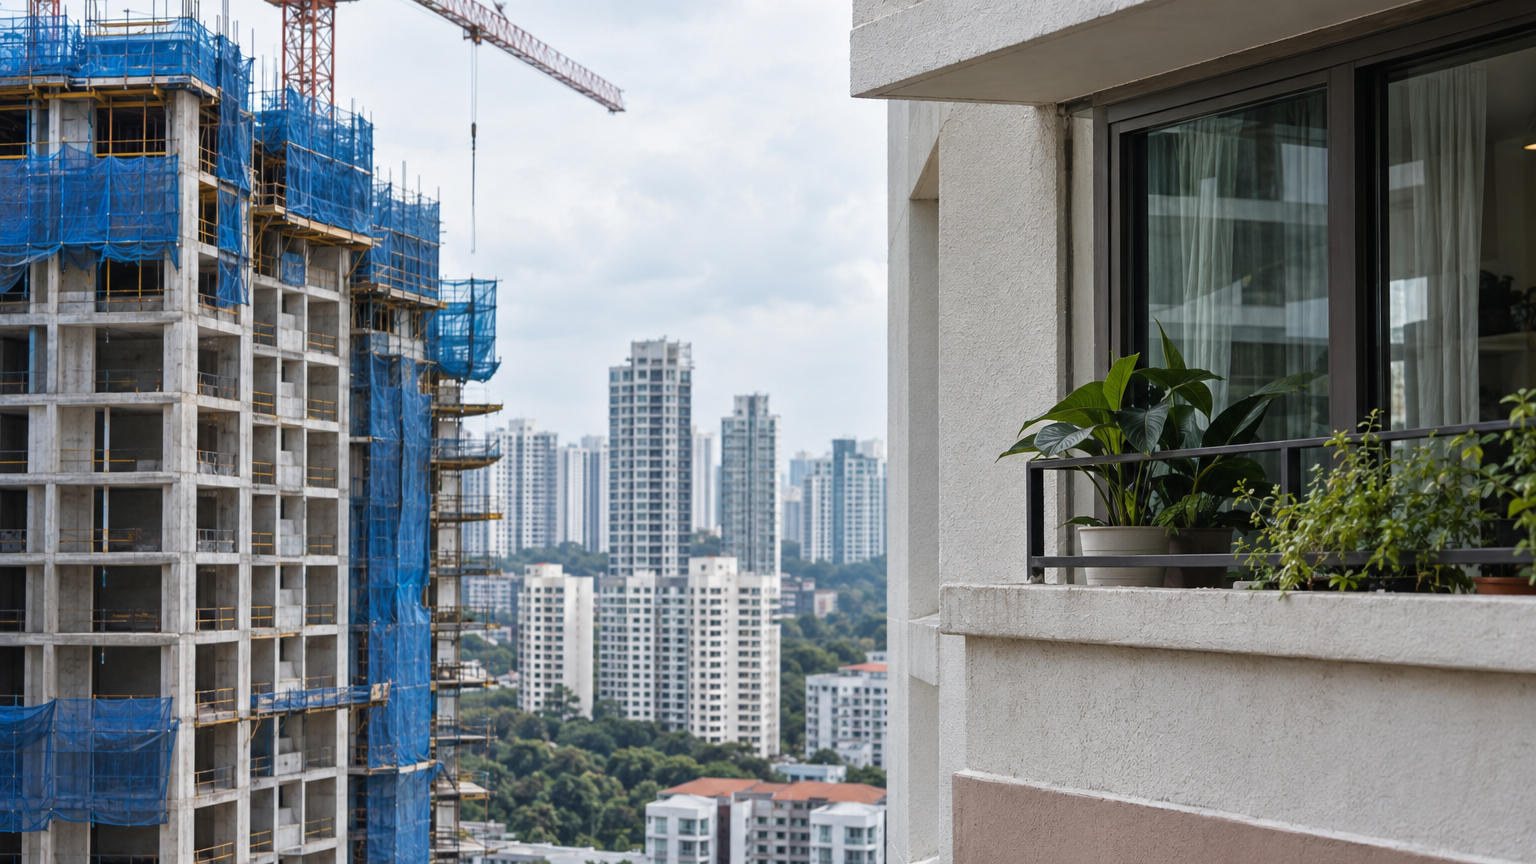
URA’s Q3 2026 figures show a smaller launch calendar and a resale-heavy market, even as the overall private-home price index rose 1.4%.
Developers sold 958 fewer new private homes in the third quarter of 2026 than in the previous quarter. Yet the resale market barely slowed: 3,801 private homes changed hands, just 12 fewer than in Q2, according to the Urban Redevelopment Authority’s final statistics released on 23 October.
That contrast is the useful part of an otherwise puzzling quarter. Developer sales fell 44.7%, while the overall private-home price index rose 1.4%. For someone comparing a new launch with a resale home, the missing detail is that developers also launched substantially fewer units—and resale transactions accounted for nearly three-quarters of the market’s sales.
The biggest change was in new-home sales
Developers sold 1,183 uncompleted private residential units, excluding executive condominiums (ECs), in Q3, down from 2,141 in Q2. The difference was 958 units, equivalent to a 44.7% decline when calculated against the previous quarter’s total.
The launch calendar was smaller too. Developers released 1,140 units for sale, compared with 1,783 in Q2: 643 fewer units, or a calculated 36.1% drop. Both the sales and launch comparisons exclude ECs, keeping the two quarters on the same basis.
Put another way, for every 100 units launched in Q2, developers launched about 64 in Q3. For every 100 new homes sold in Q2, they sold about 55 in Q3. Sales therefore fell faster than launches, but both sides of the new-home market contracted substantially.
That matters when reading the headline decline. A quarter with fewer newly released homes offers a different set of choices from a busy launch quarter. The figures establish that the new-home market became quieter; they do not establish why individual buyers bought, waited or chose another route.
There is another useful distinction in the numbers: quarterly launches and quarterly sales are not a matched batch of homes. The fact that developers sold 1,183 units while launching 1,140 should not be read as a sell-through rate for that quarter’s launches. These are separate measures of activity, rather than a scorecard for one release of homes.
Resale kept moving at almost the same pace
The resale market tells a much steadier story. Its transaction count slipped from 3,813 in Q2 to 3,801 in Q3—a calculated decline of about 0.3%, against the 44.7% fall in developer sales.
The difference in scale is striking. Developer sales lost 958 transactions between quarters; resale lost 12. For a reader asking whether private-home buying simply stopped, the resale count provides a more useful answer than the new-sales figure alone. Activity held up much more firmly in that part of the market.
Resales accounted for 73.9% of all private-home sale transactions, up from 62.0% in Q2. That is an increase of 11.9 percentage points in their share of transactions—not an increase in the number of resale homes sold. The count was almost unchanged; its weight in the market grew as new sales fell.
The distinction helps explain how the quarter could feel quiet around launches while still recording substantial buying elsewhere. However, the aggregate figures do not track individual households moving from a launch shortlist to a resale purchase. The supported finding is narrower: resale became a much larger part of completed sales activity.
Prices rose, but not evenly
Alongside that shift in transactions, URA’s overall private residential property price index rose 1.4% in Q3, following a 0.5% increase in Q2. Prices therefore rose faster even as developer sales fell. The two figures measure different things: one tracks price movements, while the other counts new homes sold.
The overall increase also hides considerable variation. Landed-home prices rose 2.9%, compared with a 1.0% rise for non-landed homes. It would therefore be misleading to treat the headline 1.4% as the quarter’s price change for every condo, let alone every individual unit.
Within the non-landed market, prices in the Outside Central Region rose 2.3%. The Rest of Central Region was unchanged, while the Core Central Region recorded a 0.3% increase. Even within the broad condo and apartment market, there was no single pace of growth.
For a buyer, the useful comparison is therefore closer to the type and location of the home being considered. The overall index gives a broad reading of the market; the segment figures show why applying that reading directly to one seller’s asking price would miss important differences.
More homes were completed—and vacancy increased
Q3 also brought a sizeable addition to finished housing. URA recorded 3,559 private residential completions, including ECs, the highest quarterly total since Q3 2024. Separately, the vacancy rate for completed private homes excluding ECs rose to 7.2%, from 6.4% in Q2.
Those figures describe another part of the housing picture, distinct from launches and sales. Completions concern homes reaching the finished stock; vacancy concerns the proportion of completed homes that are unoccupied. Neither is a count of homes newly released by developers for purchase.
The EC distinction matters here. The completion total includes them, while the quoted vacancy rate and headline developer-sales comparison exclude them. Combining all three as though they covered exactly the same pool would blur the picture rather than clarify it.
The next question is how much supply reaches buyers
At the end of Q3, URA counted 20,300 unsold private residential units, including ECs, with planning approval. It also said about 32,800 units could be made available for sale over the following one to two years. These describe supply at different stages, not two separate totals to add together.
The potential pipeline is relevant to buyers looking beyond the quieter quarter, but it is not a promise that every unit will arrive at once. Nor does the estimate say what those homes will cost or how quickly they will sell. Its immediate value is as a measure of possible future choice.
Q3’s clearest change was where transactions took place: a sharply smaller developer-sales market sat alongside a largely steady resale market. The next development to watch is whether more of the potential supply reaches the launch market—and whether buyers take it up.