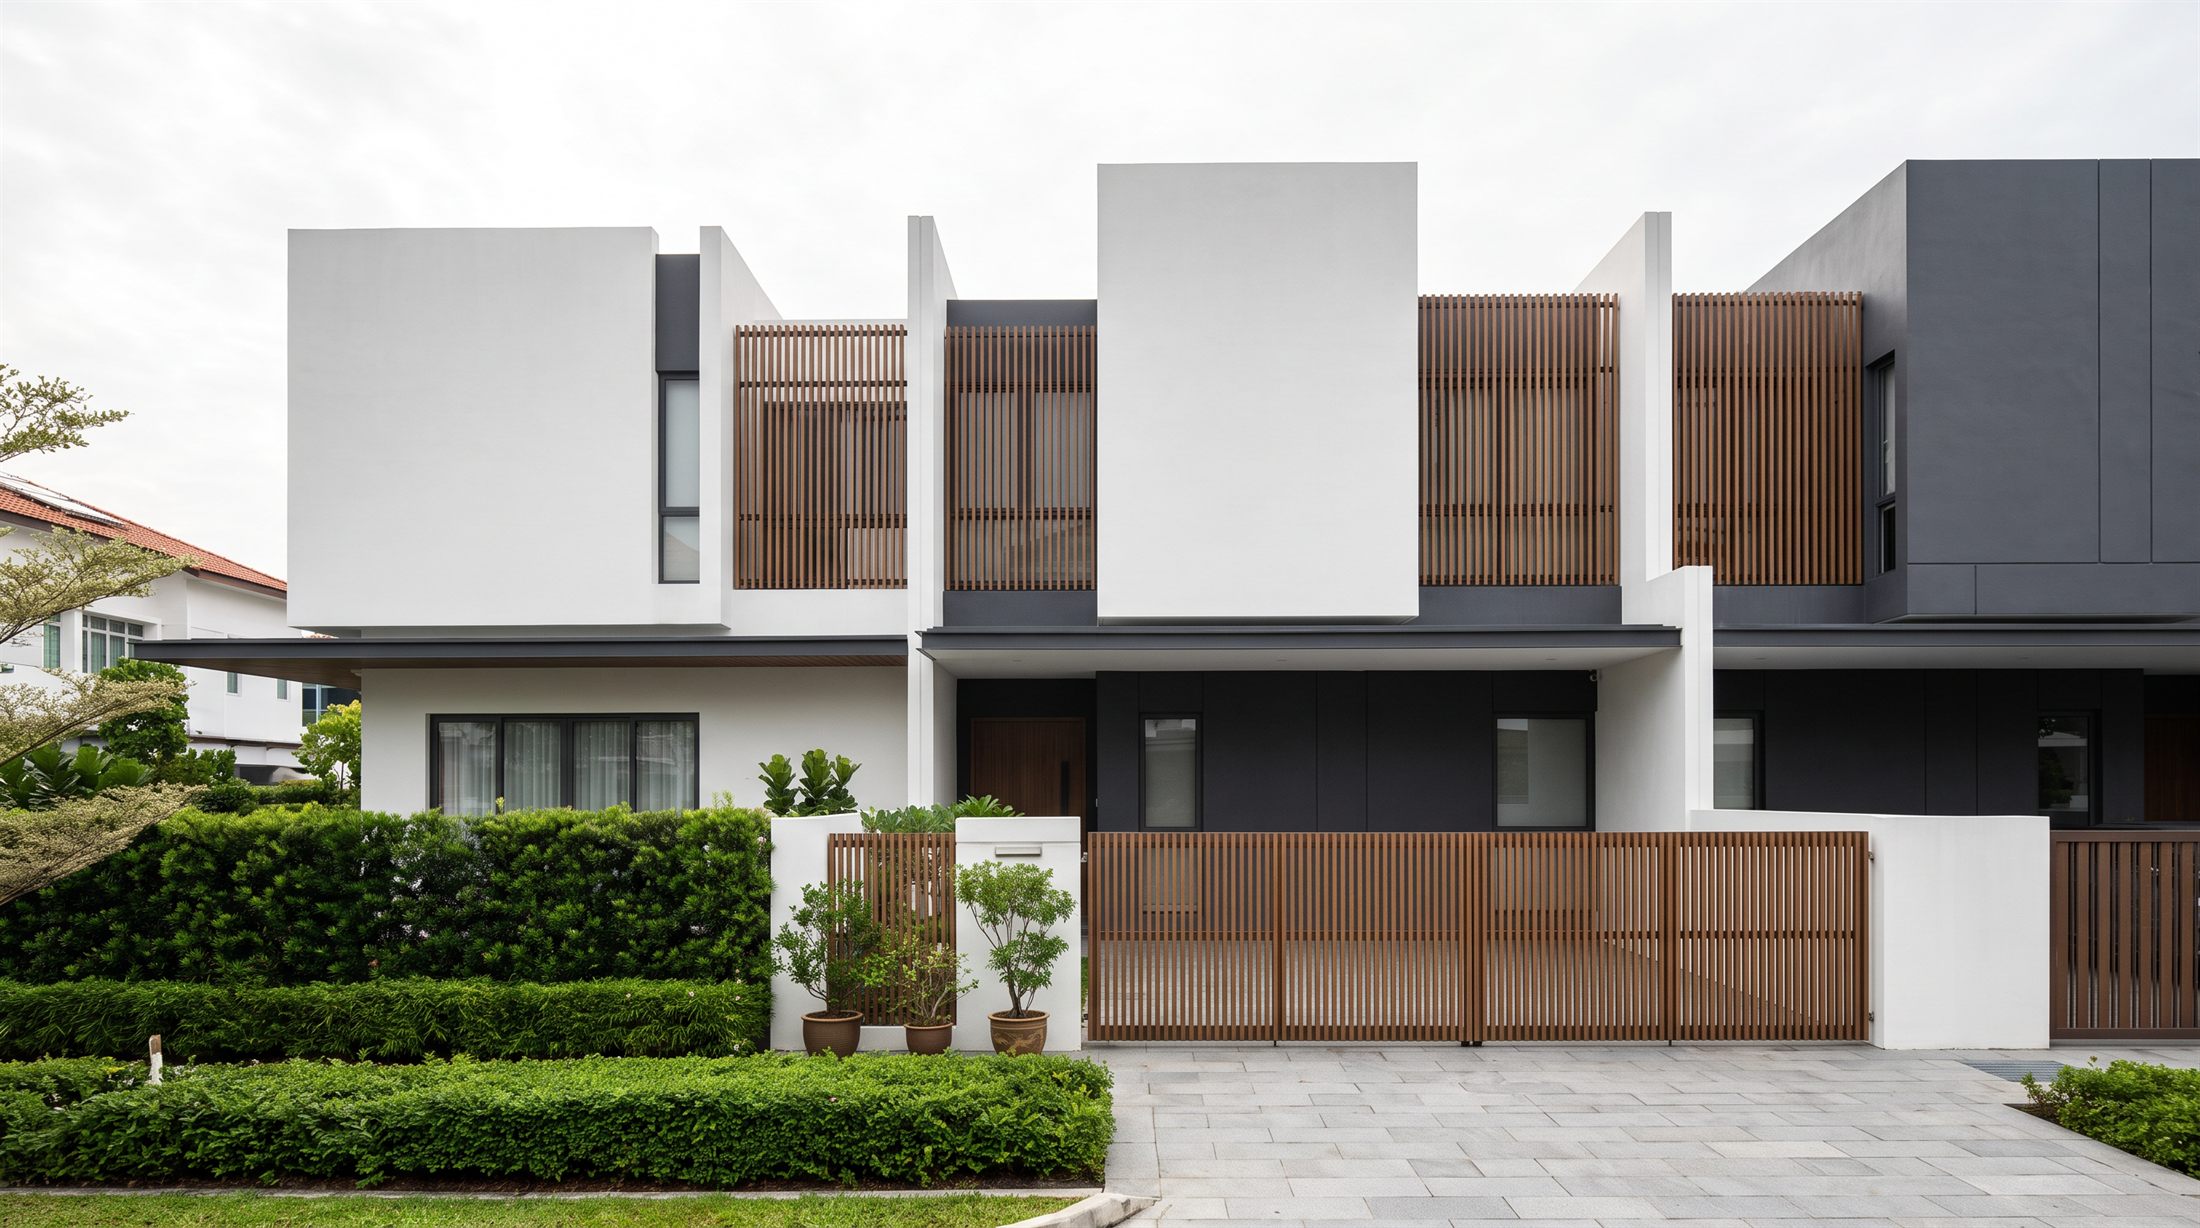
 plan
Landed prices rose 2.9% in Q3 2026, outpacing the wider private market
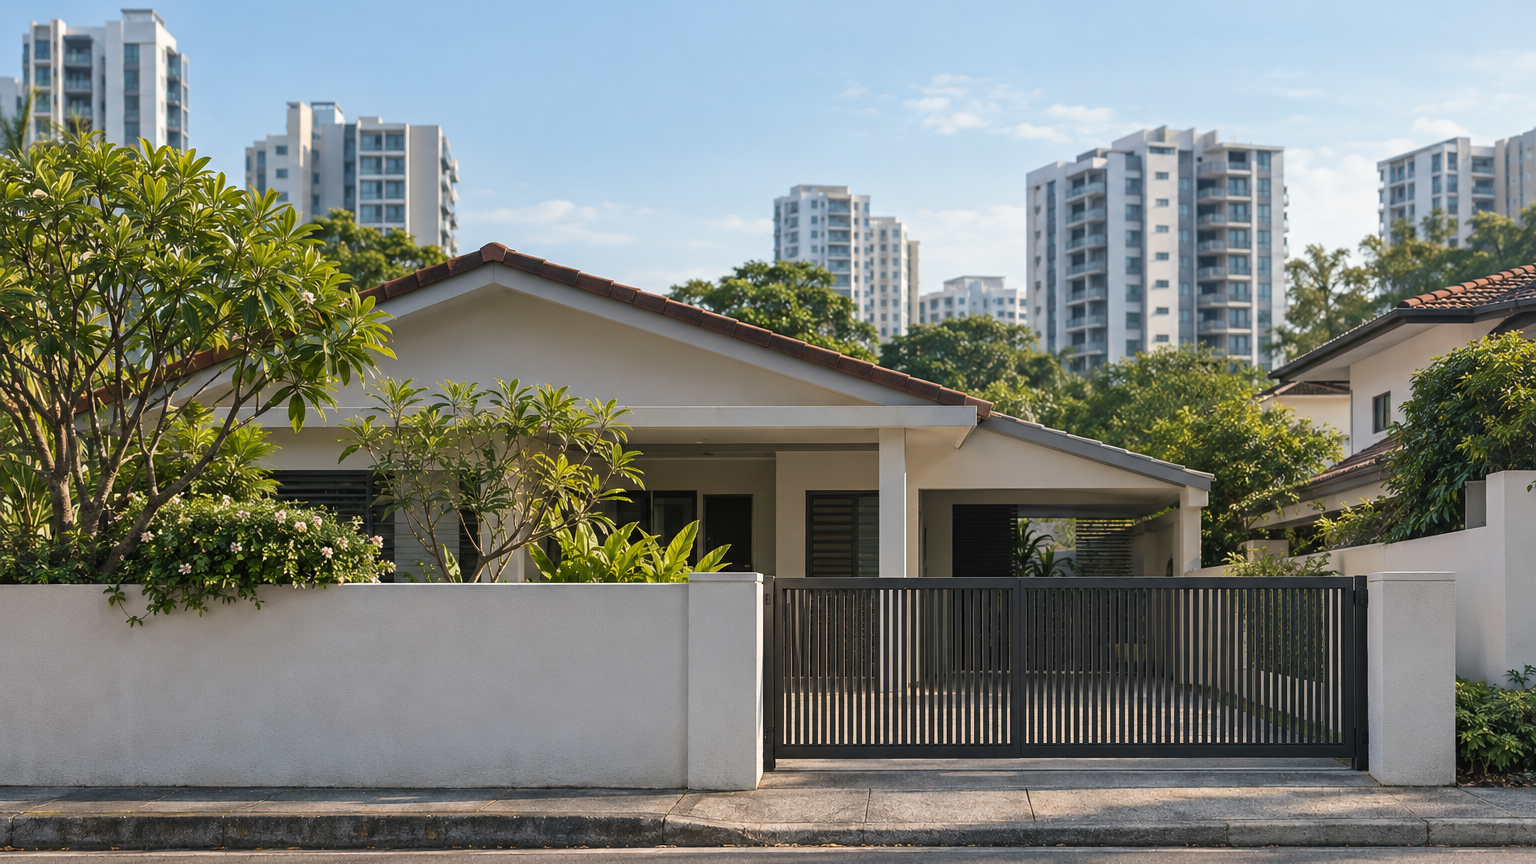
The overall index rose 1.4%, against 1.0% for non-landed homes. The gap gives landed buyers a more relevant backdrop—not an automatic adjustment to a comparable sale.
Singapore’s Landed private residential price index rose about 2.9% between Q2 and Q3 2026, compared with 1.4% for Residential Properties overall and 1.0% for Non-Landed. The official URA-sourced SingStat series shows all three moving upwards, but at distinctly different speeds. These percentage changes are calculated from the published index levels.
For someone considering a landed home, the useful distinction is between the market-wide backdrop and the segment relevant to the purchase. The overall increase understates the landed segment’s quarterly movement. That makes it worth asking which benchmark sits behind a seller’s price comparison—before asking whether the comparison fits the house itself.
What changed between Q2 and Q3
The table below uses the source’s exact series names. All levels share the same base: 1st Quarter 2009 = 100. Percentage changes are our calculations from the displayed Q2 and Q3 observations, rounded to one decimal place.
| Series | Q2 2026 index | Q3 2026 index | Change in index points | Calculated quarterly change |
|---|---|---|---|---|
| Residential Properties | 219.4 | 222.5 | +3.1 | +1.4% |
| Landed | 258.4 | 265.9 | +7.5 | +2.9% |
| Non-Landed | 210.6 | 212.7 | +2.1 | +1.0% |
Source for the index levels: the official SingStat table, sourced to URA. Differences and percentage changes are calculated from those levels.
The landed gain exceeded the overall gain by approximately 1.5 percentage points, and the non-landed gain by approximately 1.9 percentage points. These gaps compare rates of change—not house prices in dollars, and not the price difference between landed and non-landed homes.
This is a retrospective analysis of the named quarter, not a fresh-release report. The captured official table records an update date of 23 October 2026. That is the date supported by the retained source; it should not be confused with the later date on which the table was retrieved.
Why 7.5 index points is not a 7.5% increase
The landed index increased by 7.5 index points, from 258.4 to 265.9. To find its percentage increase, the difference must be divided by the starting level, rather than treated as a percentage on its own.
The calculation is:
(265.9 − 258.4) ÷ 258.4 × 100 = approximately 2.9%.
That denominator matters. An index point is a unit on the published scale; a percentage change describes how large the movement was relative to where the series began. Comparing the percentage changes therefore gives a clearer answer to the question “which segment rose faster this quarter?” than simply comparing their point increases.
The overall result also is not a simple halfway point between the two segment growth rates. The published methodology says price movements are combined using five-quarter fixed weights. Taking an unweighted average of 2.9% and 1.0% would not reproduce that method.
The practical reading is straightforward: the overall index describes the combined market, while the two segment series reveal a difference that the combined number compresses. For this particular quarter, “private prices rose 1.4%” is accurate context, but incomplete context for a discussion focused on landed housing.
What the index measures—and why that matters
Since Q1 2015, the private residential price indices have used a stratified hedonic regression method. In everyday terms, the method controls for differences in transacted properties, including attributes such as age and unit size, before combining price movements. It aims to measure price change while accounting for those differences, rather than merely comparing unadjusted transaction averages.
The underlying information comes from caveats lodged with the Singapore Land Authority, stamp-duty data from the Inland Revenue Authority of Singapore, and data supplied by developers. This is a transaction-based statistical measure, not a compilation of sellers’ asking prices.
Both quarters in this comparison fall within the methodology described as applying from Q1 2015. We are comparing observed Q2 and Q3 levels on the same published base, without projecting a later quarter or extending the result into a forecast.
The important boundary is that these are quality-adjusted aggregate indices, not individual-property valuations. The retained series establishes the difference in segment movements; it does not explain its cause or establish how much a particular house changed in value.
The better question to ask about a recent comparable sale
Our interpretation is that the landed result should sharpen the conversation about a comparable sale, rather than supply an automatic price adjustment. Start by separating two questions: what happened to the relevant broad market, and how closely does the cited property match the one being considered?
On the first question, this evidence gives a clear answer: the landed segment rose faster than both the overall and non-landed series between Q2 and Q3 2026. Using only the overall 1.4% movement would leave out that distinction.
On the second, the useful questions remain property-specific: does the comparison match the tenure, land area, location, physical condition and intended rebuilding scope? Treat those as questions to investigate, not characteristics that this index has verified for any house.
The same discipline applies to timing. A sale described merely as “recent” needs a date before anyone can decide whether the Q2-to-Q3 comparison is relevant. Even then, applying the landed increase mechanically would turn a segment measure into something it was not designed to provide.
The clearest consequence of Q3’s figures is therefore a more precise starting point: use the landed series to frame the market discussion, then establish why the actual comparable deserves to anchor the price. The quarterly number answers the broad-market question; the house-to-house comparison is still the work to be done.