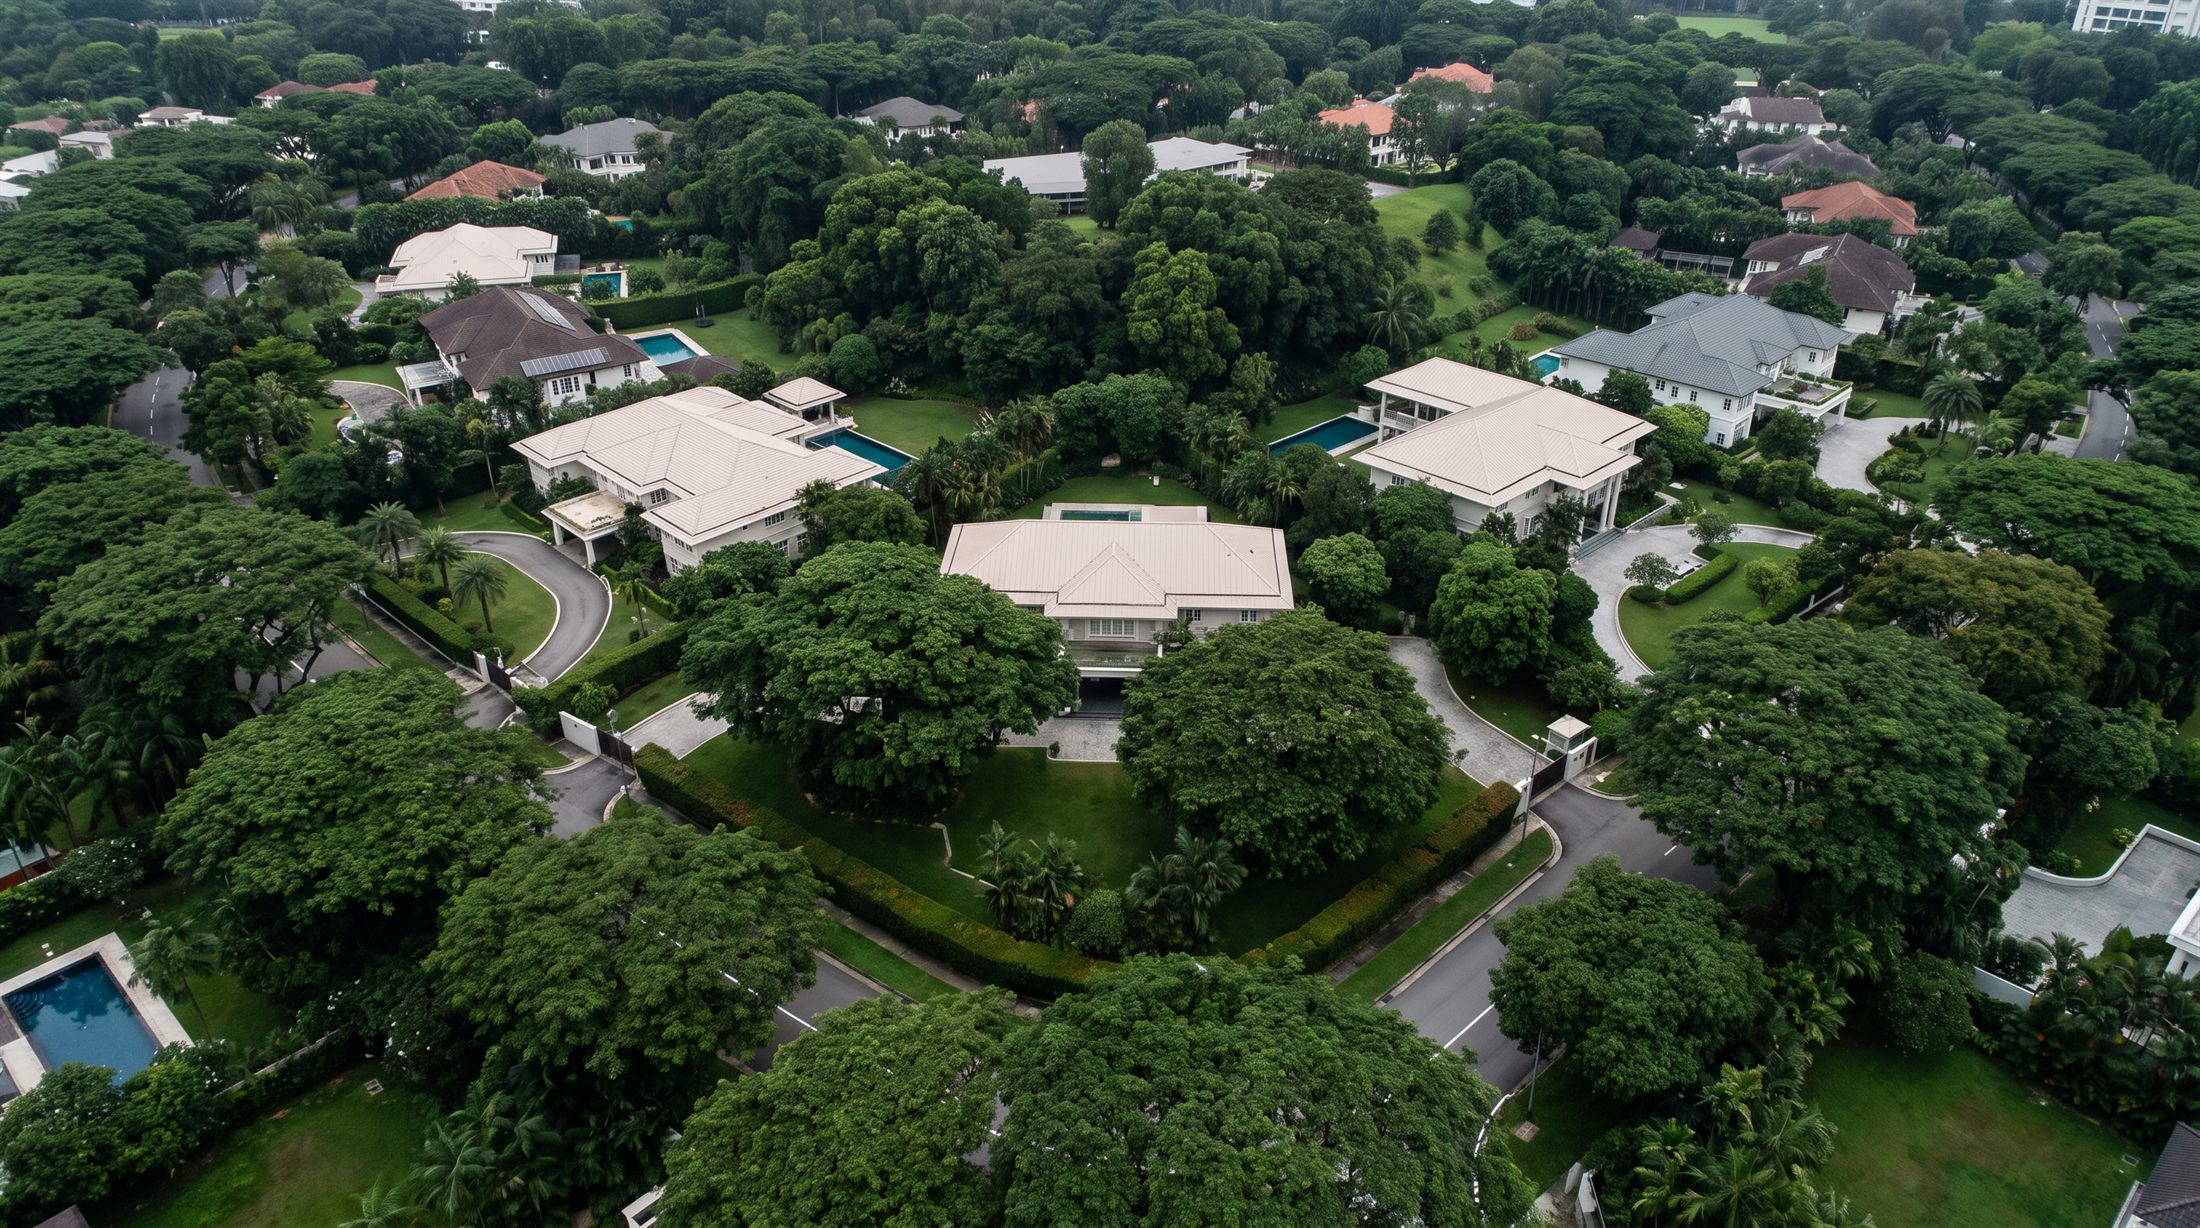
 plan
HDB resale activity jumps as prices edge down; private homes rise 1.4%
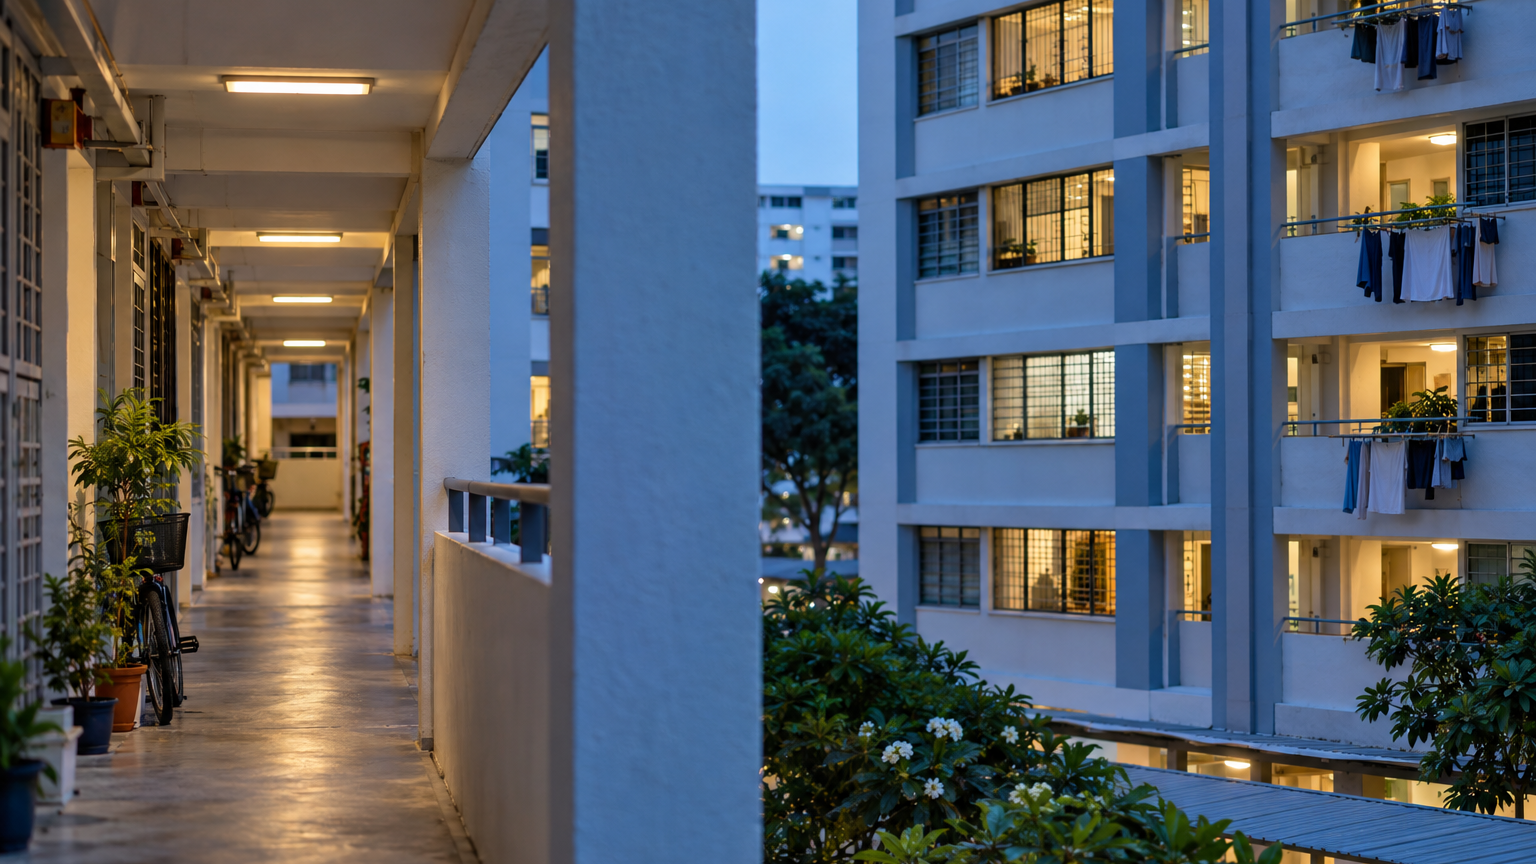
Final third-quarter 2026 figures show 7,645 HDB resale transactions, while landed homes posted a bigger price increase than non-landed properties.
More HDB resale flats changed hands in the third quarter of 2026, even as the overall resale price index edged down. Final figures released by the Housing & Development Board on 23 October showed 7,645 transactions, up 19.5% from the previous quarter, alongside a 0.1% decline in its Resale Price Index.
Private-home prices went the other way. The Urban Redevelopment Authority’s final figures, released the same day, showed a 1.4% quarterly increase, up from 0.5% in the second quarter. For someone comparing an HDB resale flat with a private home, the interesting contrast is not simply falling versus rising prices: HDB resale activity picked up substantially while its price index barely moved.
More flats sold, with little change in the price index
HDB recorded 6,396 resale transactions in the second quarter and 7,645 in the third—a difference of 1,249 transactions. Compared with the 7,221 transactions recorded in the third quarter of 2025, activity was also higher, by 5.9%. The increase therefore holds against both the preceding quarter and the same period a year earlier.
Yet HDB’s Resale Price Index finished the quarter at 202.5, down 0.1%. This was its third consecutive quarterly decline, following falls of 0.1% in the first quarter and 0.3% in the second. The latest result extended that run, but the quarterly decline was smaller than in the preceding period.
Compounding those three reported quarterly changes gives an approximate 0.5% decline over the first nine months of 2026. That calculation uses rounded quarterly figures, so it is best read as an indication of scale rather than a separately published index result. The important distinction is between three consecutive declines and a large cumulative fall: these figures describe the former.
The transaction count and price index answer different questions. One records how many resale transactions took place; the other tracks overall price movement. In this quarter, they show a market in which more flats changed hands without an accompanying increase in the aggregate price measure.
The final HDB decline is 0.1%, not 0.2%
Readers who remember an earlier figure may notice a change. HDB’s flash estimate had put the third-quarter decline at 0.2%; its final release revised that to 0.1%. The final result is the figure to use when describing the quarter.
That revision changes the size of the decline, rather than its direction. HDB resale prices still registered a third consecutive quarterly fall, but the final reading shows a smaller movement than the preliminary estimate suggested.
It also puts the news in proportion. A 0.1% movement is a slight easing in the overall index, not a broad markdown across every town or flat type. Neither that percentage nor the index level of 202.5 tells a household the current price of a particular flat. The release establishes the overall direction; an individual home’s price remains a more specific question.
For an owner reading the headline alongside an asking price or valuation, that distinction matters: the national quarterly change and the price of one home are different measurements. The aggregate result provides context, rather than a replacement price for that home.
Private homes did not all rise at the same pace
URA’s 1.4% headline increase combines different property types. Landed-home prices rose 2.9% in the third quarter, while non-landed prices rose 1.0%. Someone looking at a condominium is therefore looking within a category whose reported increase was lower than the overall private-market figure.
The difference between the landed and non-landed quarterly increases was 1.9 percentage points, calculated from URA’s published figures. That spread is larger than the 1.5-percentage-point gap between the headline private-home increase and HDB resale decline. It is a useful reminder that variation within the private market also matters to the comparison.
The overall private-home increase accelerated from 0.5% in the second quarter to 1.4% in the third. But calling that a uniform condominium price rise would lose an important part of the release: landed and non-landed homes recorded distinctly different changes.
What the split leaves unanswered
Taken together, the final releases describe two different quarterly outcomes: a small HDB resale-index decline alongside increased resale activity, and a faster rise in the overall private-home price index, with landed homes recording the larger increase.
They do not provide an explanation for why the two markets diverged, or establish that households moved from one into the other. Answering those questions would require evidence about the buyers and transactions behind the totals, rather than simply comparing the two headline percentages.
For households comparing actual homes, the unresolved question is narrower and more useful: how closely did their chosen town, flat type or private development follow these broad movements? The quarter’s clearest finding is already concrete—HDB resale activity rose even while its overall price index eased. Explaining the experience of a particular home requires the next layer of detail.