Greenleaf · King's · Mount Sinai · Ming Teck Parkmastplan
One hundred and fifty-eight freehold and 999-year landed sales in the Holland ring, read pocket by pocket. It is the most central landed pocket in Singapore and one of the smallest — and the house that clears the highest rate per square foot of ground is the smallest one on the street, not the biggest.
158
freehold / 999-yr landed sales, late 2022 – Jul 2026
1 in 9
District 10 sales that are landed at all
$2,840
median land PSF on terrace — the top type median
What is actually being measured
Every figure on this page is land PSF: the transacted price divided by land area, not by built-up area. It is the only basis on which a 2,000 sqft terrace and a 10,000 sqft bungalow can be compared at all, and it is the reason the rankings on this page look upside down compared to the ones people quote each other over a fence.
Medians throughout, never averages — in a market this thin a single $22M sale would drag an average somewhere useless. House type is held constant in every comparison that claims to be a comparison. Where a cell rests on five sales or fewer it is called out where you read it, not in a footnote.
And the window matters. This data runs from late 2022 to July 2026 — about three and a half years. That is long enough to price the ground with confidence. It is not long enough to call a cycle, and nothing below is written as though it were.
Finding one — a low-rise island in a rising sea of towers.
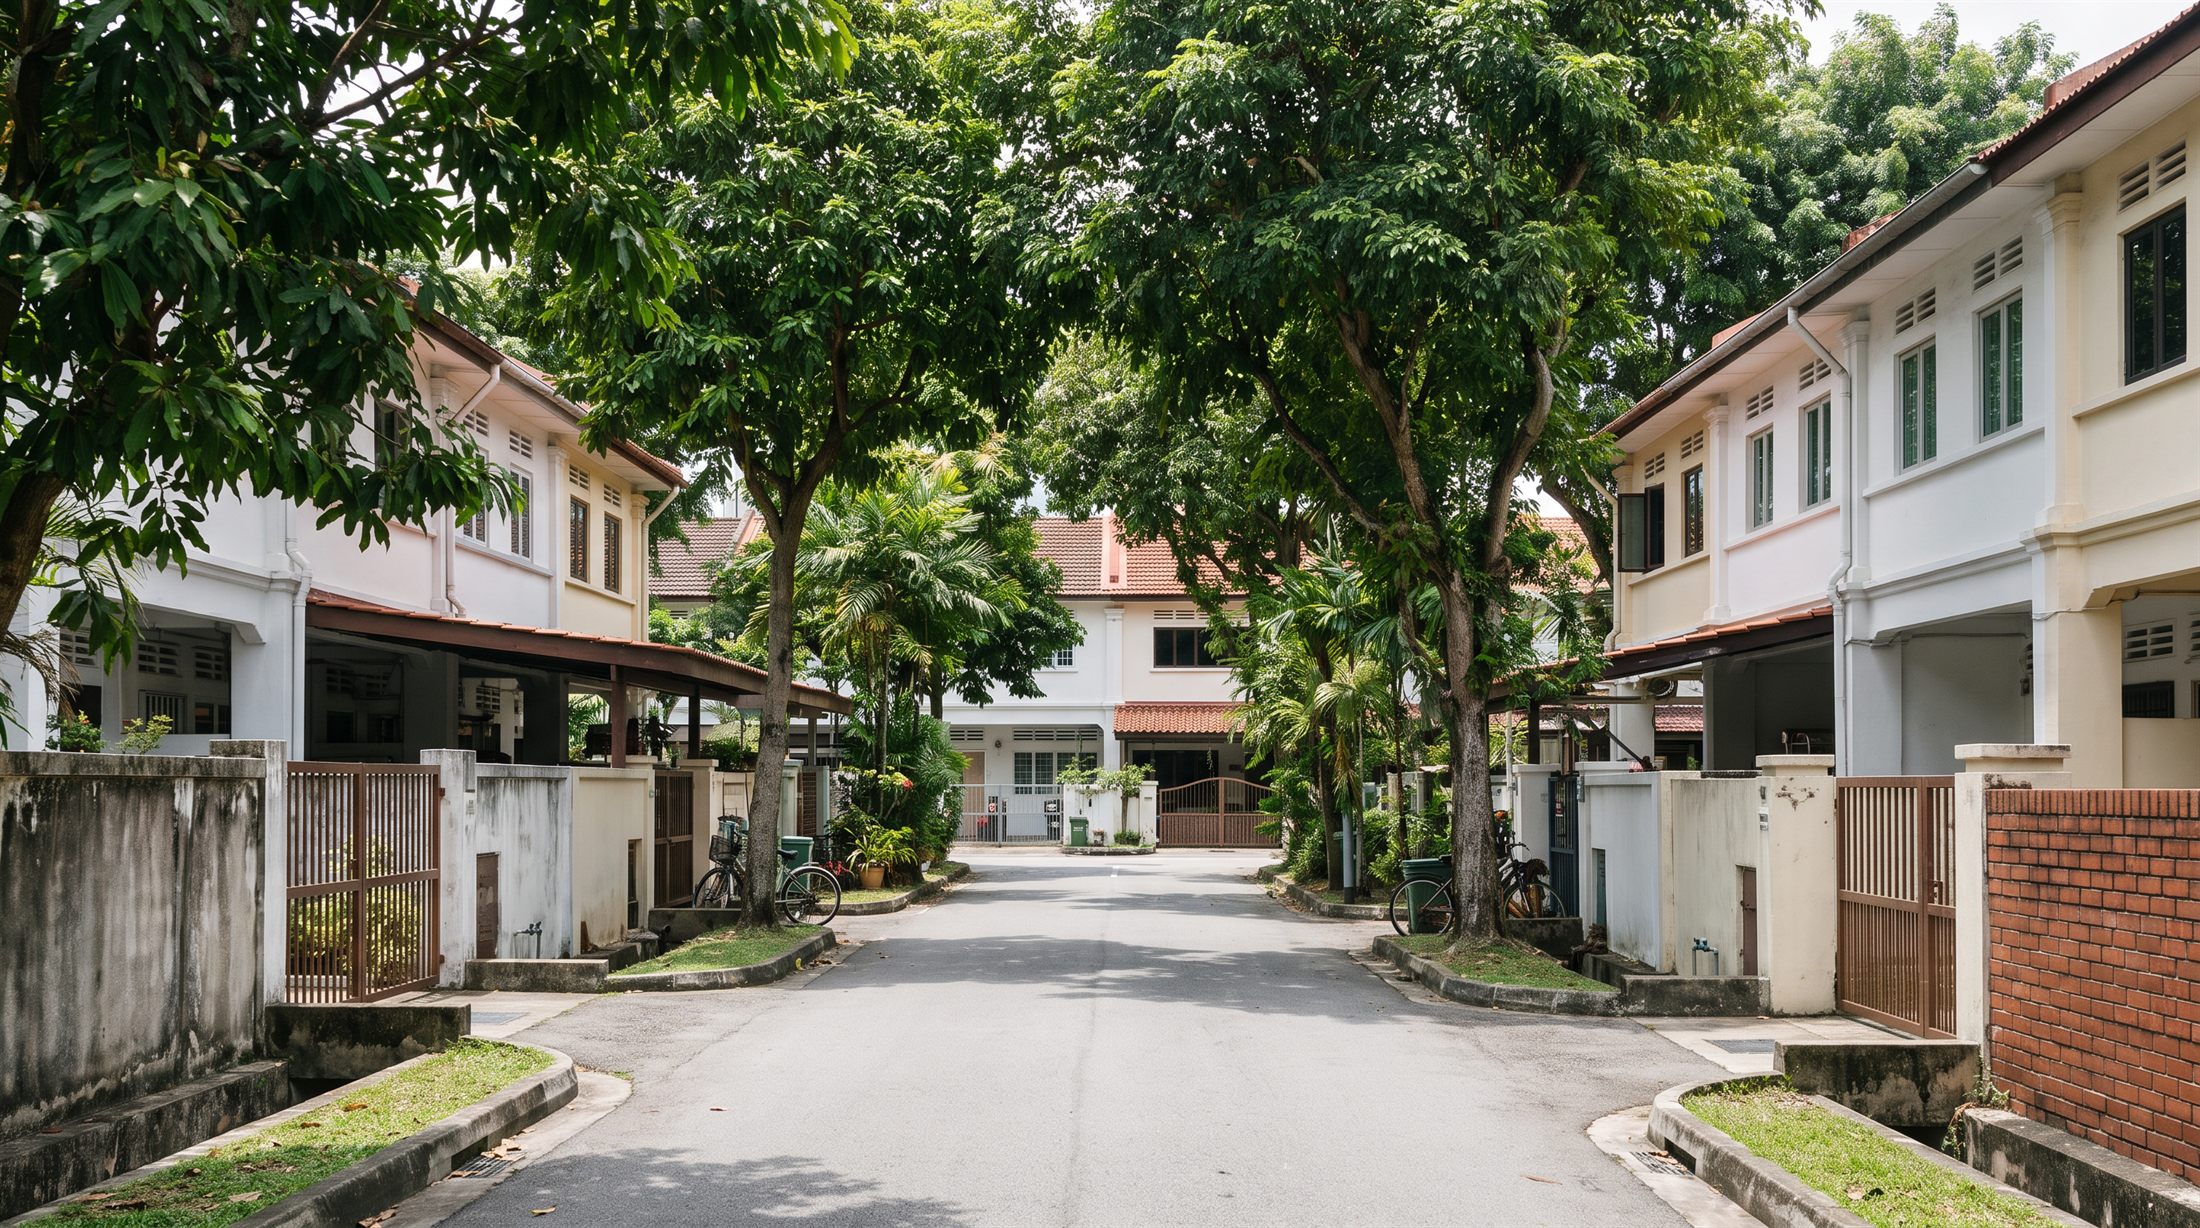
Holland's landed ring is small, old, and structurally incapable of getting bigger. Roughly one in nine District 10 transactions is a landed home at all; the other eight are apartments, and the pipeline is adding to that side of the ledger, not this one. One Holland Village, Van Holland and Skye at Holland are all reshaping the core, and none of them add a single landed plot.
You are buying into fixed supply against rising density. That is the most durable argument for holding land here, and it is an argument about stock, not about any one year's price.
One honest caveat on the headline. One in nine is a share of transactions, not a share of stock. It is a fair proxy — landed homes turn over slowly and apartments turn over fast, so if anything the transaction share understates how thin the landed stock really is. But it is a different measurement from the one the sentence sounds like, and the difference is worth knowing before you repeat it.
158 sales in three and a half years, by property type
This is the entire market. Not the entire market this quarter — the entire market, every freehold and 999-year landed transaction across the whole Holland ring since late 2022.
Transaction counts. URA private residential data, late 2022 – Jul 2026. Freehold and 999-year land title only.
Ten detached sales a year across every enclave in Holland is not a market with a price. It is a market with a handful of data points, which is exactly why the pocket-level figures below have to be read with their sale counts attached.
You’ve seen the first priced comparison
You've seen how small it is. Now see what it costs.
You’ve seen the first priced comparison. The full audit explains why similar Holland Village homes trade differently — and which location, land and rebuild factors move the number.
The inversion — the full type table, and why the smallest house sits on the priciest ground.
The six pockets — fourteen cells, thin ones marked, and the $330 spread on an identical house type.
The central premium — two Circle Line stations, one-north, and what the trend actually shows.
The new-build tell — plus rebuild and A&A economics, tiered properly.
Open the full audit
Enter your details for instant access — about 30 seconds.
You're in.
The remaining four findings are open below.
Instant accessNo account requiredRelevant follow-up only
Finding two — the smallest houses sit on the priciest ground.
Line the three property types up on land PSF and the ranking runs backwards from the one everybody carries in their head. Terrace is the most expensive ground in Holland. Detached is the cheapest. The bungalow costs three times as much in total and less per foot of the land it stands on.
Median plot size against median land PSF, by property type
The bars are how much ground you get. The line is what each foot of it costs. They move in opposite directions, and that is the whole finding.
Median plot size (sqft)Median land PSF
URA private residential transactions, late 2022 – Jul 2026. 158 freehold / 999-yr sales.
Holland freehold and 999-year landed · by property type
Property type
Sales
Median land PSF
Median price
Plot (sqft)
Terrace
35
$2,840
$6.00M
2,066
Semi-detached
87
$2,478
$8.90M
3,729
Detached
36
$2,184
$17.8M
7,809
mastplan
Median land PSF, computed on land area. Late 2022 – Jul 2026.
A terrace clearing $2,840 PSF is not evidence that a nearby bungalow is underpriced at $2,184.
This is the single most misused number in landed conversation. The two figures are not in competition. Small plots carry a higher rate per foot everywhere in Singapore, for the simple reason that the house, the driveway and the roof are a much larger share of what you are buying when the land underneath them is small. The rate per foot falls as the plot grows because you are progressively buying more of the cheap part.
Which also means the spread inside a single type is where the real money is. Across the middle of the detached market a plot cleared anywhere from roughly $1,930 to $2,820 PSF — a band of about $890 per foot, on the same property type, in the same district. On a 7,800 sqft plot that band is worth close to $7 million.
One correction to the way this data usually gets summarised. $2,840 is the highest type median, not the highest figure in this audit. Two individual pockets clear above it — and one of them is a detached cell, which cuts directly against the pattern this finding just established. Finding Three has both.
Finding three — one name, six different markets.
"Holland" on a listing can mean any of six distinct pockets, and they do not trade alike. Below is every enclave-and-type cell in the dataset, plotted on the same axis, coloured by property type so the inversion from Finding Two can be checked against fourteen separate readings rather than three.
Median land PSF — every pocket, every property type
Read the colours, not the order. The terraces cluster at the top, the detached at the bottom, and the two cells that break the pattern are the two thinnest ones on the chart.
TerraceSemi-detachedDetached
Median land PSF by enclave and property type. URA private residential transactions, late 2022 – Jul 2026.
Greenleaf detached at $3,246 is the highest single figure in this audit and it sits on five sales. It is also, per Finding Five, a cluster of recently rebuilt compact houses on smaller-than-typical detached plots — which is to say it is behaving like a large semi-detached, and pricing like one. It is a real observation about five houses. It is not a rate you should apply to a 7,000 sqft bungalow two streets away.
Holland freehold and 999-year landed · by pocket and property type
Pocket
Type
Sales
Land PSF
Median price
Plot (sqft)
King's / Queen's
Semi
18
$2,616
$9.69M
3,778
King's / Queen's
Terrace
5
$2,669
$7.20M
2,599
Mount Sinai
Terrace
8
$3,194
$5.73M
1,754
Mount Sinai
Semi
10
$2,526
$8.83M
3,418
Holland Rd / Park
Semi
10
$2,510
$7.86M
3,510
Holland Rd / Park
Detached
10
$1,882
$11.59M
5,625
Ming Teck Park
Terrace
12
$2,656
$5.94M
2,014
Ming Teck Park
Semi
7
$2,460
$8.50M
3,346
Greenleaf / Grove
Semi
32
$2,286
$8.62M
3,902
Greenleaf / Grove
Terrace
8
$2,666
$6.66M
2,318
Greenleaf / Grove
Detached
5
$3,246
$16.00M
5,321
Holland Grove
Semi
6
$2,352
$9.60M
3,892
Holland Grove
Detached
5
$2,186
$15.80M
7,100
Farrer / Leedon
Detached
5
$2,037
$22.00M
10,801
All fourteen cells
—
141
—
—
—
mastplan
Ming Teck Park is 999-year land title; the rest are freehold. Cells on five sales are thin and marked as such above.
These fourteen cells cover 141 sales, not 158. The remaining seventeen — mostly detached — transacted on streets that sit outside the named enclaves or in cells too thin to publish at all. The type table in Finding Two covers the full 158. The two tables are drawn on different boundaries and they are not supposed to reconcile, which is worth saying out loud rather than letting the numbers quietly disagree.
Now hold the property type constant and look at what the pocket alone is worth. Six pockets trade semi-detached houses. Same type, same district, same three-and-a-half-year window.
Semi-detached land PSF, by pocket — and what the gap is worth
Zero-baselined, so the bars look close together. They are: about 14% top to bottom. The column on the right is the same gap expressed as money on a median-sized plot, which is the only unit anybody actually transacts in.
Median land PSF, semi-detached only, late 2022 – Jul 2026. Dollar gaps are the PSF difference applied to a 3,800 sqft plot — roughly the Holland semi-detached median.
Greenleaf and Grove is the value-and-volume cornerThe largest median plot of the six at 3,902 sqft, the cheapest ground at $2,286 PSF, and by a distance the deepest market — 32 semi-detached sales, more than the next two pockets combined. If you want a figure you can rely on, this is the one cell in the audit with enough transactions behind it to deserve the confidence.
King's, Queen's and Mount Sinai are the premium end$2,526 to $2,616 PSF on visibly smaller plots — 3,418 and 3,778 sqft against Greenleaf's 3,902. Part of that premium is the size gradient from Finding Two doing its usual work. The rest is position, and position is not something this dataset can separate out.
The spread is $330 per foot on an identical house typeOn a 3,800 sqft plot — roughly the Holland semi-detached median — that gap is worth about $1.25 million. Same house type, same district, one name on the listing.
Ming Teck Park is the tenure asterisk999-year land title rather than freehold. In practice the market prices 999-year and freehold within touching distance of each other, and its $2,460 semi median sits mid-table exactly as you would expect. Worth knowing it is there; not worth discounting for.
Finding four — you are paying to be central.
Holland is not priced on its houses. It is priced on the fifteen minutes between it and the CBD, and on the fact that the landed ring sits inside a transport and employment cluster that almost no other landed pocket in Singapore can claim.
Two Circle Line stations, and an interchange one stop awayHolland Village (CC21) and Farrer Road (CC20) both sit on the Circle Line. Buona Vista (CC22/EW21) — the East-West interchange — is one stop from Holland Village. Very few landed enclaves anywhere on the island have two stations of their own.
one-north on the doorstepSingapore's 200-hectare research and technology cluster — biomedical, AI and media — plus NUS, minutes away. This is the demand side of the equation that most landed audits leave out entirely: the buyers are frequently working inside it.
Henry Park Primary, on Holland Grove RoadThe primary school that actually sits in the enclave rather than near it. Every landed pocket in Singapore claims a school; this is the one whose address is inside the ring.
About fifteen minutes to the CBDCentral without being in town — which is the specific trade this district exists to sell, and the reason the ground here does not price like the rest of District 10's landed.
Position before area — in Holland the premium is bought at the boundary, not inside it.
Median semi-detached land value rose about 7 percent between 2023 and 2026, in something close to a straight line. Read that for what it is: three and a half years of steady, unspectacular appreciation on the deepest, most reliable cell in the dataset. It is not a growth story and it is not being sold as one. It is what a fixed-supply, high-demand pocket does when nothing dramatic happens to it.
Finding five — when land looks like it jumped 24%, look at the houses.
There is exactly one figure in this dataset that looks like a break. Detached land PSF sat near $2,100 for three straight years and then printed $2,632 in 2026. Taken at face value that is a 25% re-rating of Holland's most expensive real estate inside twelve months. It is not what happened.
Median land PSF, 2023 against 2026 — by property type
Semi-detached is the honest line: +7.2% over three and a half years on 87 sales. Detached is the interesting one, and interesting is not the same as real.
20232026*
*2026 is a part year. Detached 2023 figure is the approximate level held across 2023–2025.
What the semi-detached line is telling you$2,380 in 2023 to $2,551 in 2026 — up 7.2%. Eighty-seven sales underneath it, spread across six pockets and three and a half years. This is the trend statement in this audit that carries real weight.
What the detached line is telling youFlat near $2,100 across 2023, 2024 and 2025, then a small run of recently rebuilt compact houses transacts in 2026 — smaller plots, newer buildings, higher rate per foot. The median moves. The ground did not.
The tell is in the plot sizes, not the pricesThe Greenleaf detached cell that clears $3,246 PSF sits on a 5,321 sqft median plot. The Farrer and Leedon detached cell that clears $2,037 sits on 10,801 sqft. That is not two prices for the same thing. It is the Finding Two size gradient, showing up inside a single property type.
Which means the 2026 detached figure is not a comparableIf you own a 7,000 sqft detached plot with a house from the nineties on it, $2,632 is not your number and applying it will cost you a broken deal at valuation. $2,184 — the three-and-a-half-year type median — is the honest starting point.
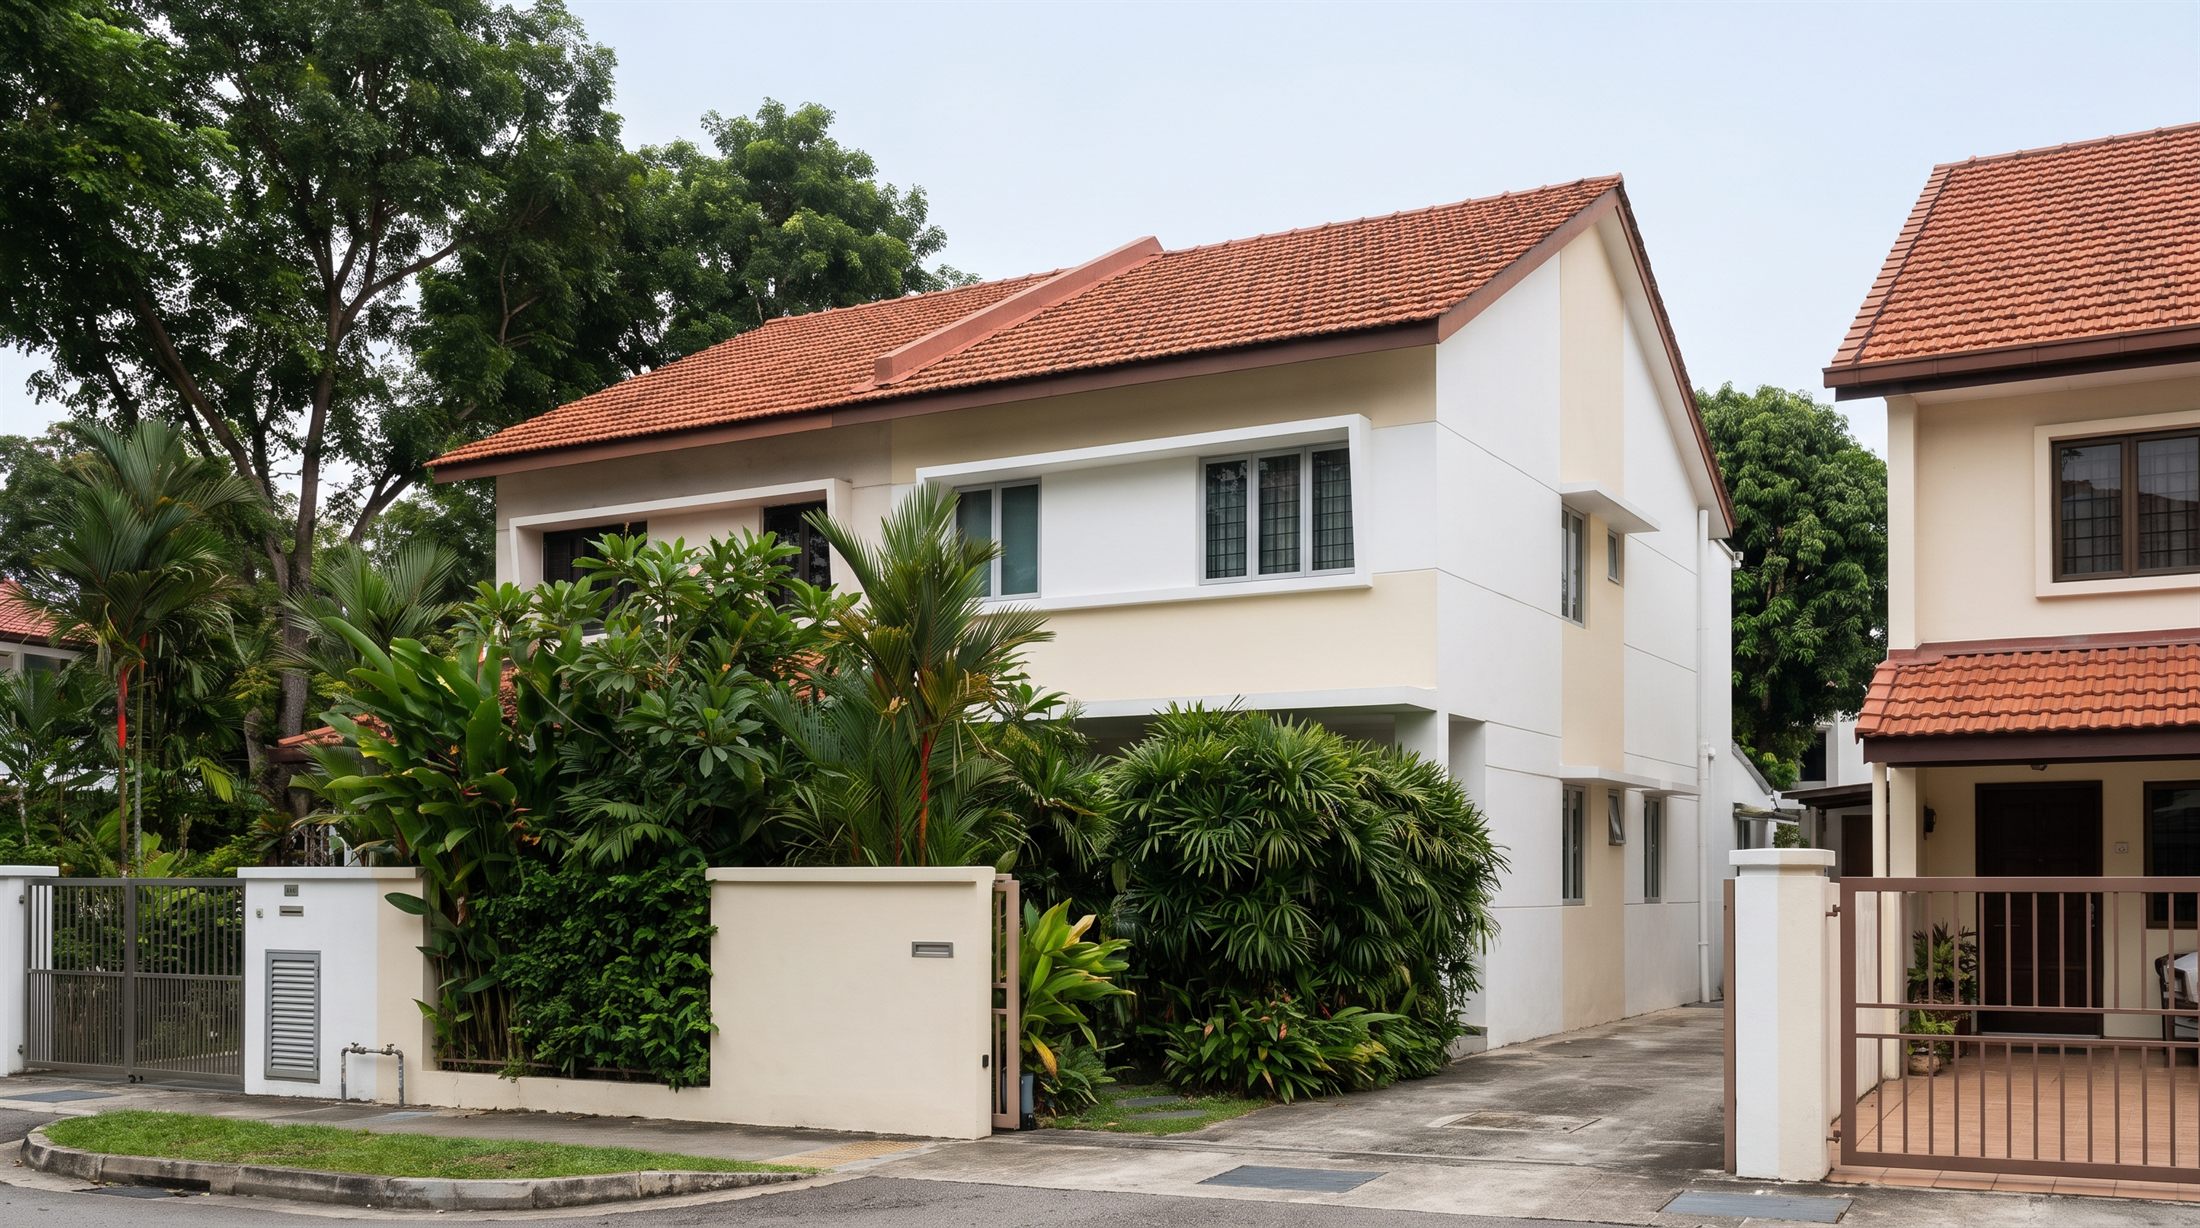
The reason this matters beyond one chart: rebuilt compact detached houses in Holland clear roughly terrace-level rates per foot. That is a genuine finding about what the market pays for. It is just not a finding about land appreciation, and the two get confused constantly because they show up in the same median.
Which raises the question every detached owner in this pocket eventually asks. Is it worth rebuilding? The costs, tiered properly rather than quoted as one flat range:
What it costs to change the house, per sqft of built-up area
The single flat figure most owners are quoted collapses three very different jobs into one number. They are not interchangeable, and neither are their timelines.
2026 industry ranges for landed work in Singapore, per sqft of built-up area. Ranges, not quotations — they move with the tender market and with site access.
Eighteen to twenty-four months of full reconstruction is not only a cost. It is a period during which the plot produces nothing, the loan runs, and the market does whatever it does. On a three-and-a-half-year dataset showing 7% total appreciation, a two-year rebuild consumes most of the window the numbers on this page describe. That is the calculation, and it is a plot-level one — not an estate-level one.
The through-line of this audit
Land PSF falls as plot size rises. The terrace on the priciest ground is not evidence the bungalow is cheap.
Six pockets trade under one name. On an identical semi-detached the spread is $330 a foot — about $1.25M on a median plot.
Greenleaf and Grove is the only cell in this audit with enough sales behind it to be confident about.
The scarcity argument is about stock, and it is the strongest structural case here. The price trend is 7% over three and a half years, and that is all it is.
The 2026 detached figure is a composition effect on rebuilt compact houses. It is not a comparable for an older, larger plot.
mastplan
How this audit was built
158 freehold and 999-year land-title landed properties sold in and around the Holland enclaves — Greenleaf and Grove, Holland Grove, Holland Road and Holland Park, Ming Teck Park, Mount Sinai, King's and Queen's Road, and the Farrer and Leedon fringe — drawn from URA private residential transaction data covering late 2022 to July 2026.
All PSF figures are land PSF, computed on land area, not built-up area.
Medians throughout, never averages — one $22M sale should not set a pocket's figure.
Property type is held constant in every comparison that claims to be one.
Leasehold, strata cluster developments and the state-owned Chip Bee terraces are excluded.
Cells drawn from five transactions or fewer are marked thin where they are read.
The type table covers all 158 sales; the pocket table covers 141. They are drawn on different boundaries and are not reconciled.
The window is the main limitation. Three and a half years is enough to price ground with confidence and not enough to describe a cycle. Any sentence on this page that sounds like a forecast is not one.
Two things sit outside public data and no audit can invent them: asking prices, because URA records only what transacted, and built-up area, which is not published. Both move your own number materially, and both are why the last figure in any audit belongs to the plot rather than to the pocket.
The plot, not the pocket
Get your own plot read.
This audit can price six pockets. It cannot price your house — Finding Two and Finding Five are both reasons why. Three things move your number by six figures and none of them are in public data: your built-up area, your unused envelope, and where your plot sits on the size gradient inside your own type. Send us the street and house type and we'll come back on all three.
Your plot, checked firstThe right sales to compareYour school and MRT positionRebuild or sell as-isYour number, one figure
Got it.
We'll come back to you shortly with your plot read.
About the figures Land-PSF, price, plot-size and sales-count figures are computed from URA private residential transaction data covering late 2022 to July 2026 (158 freehold or 999-year land-title landed properties around the Holland enclaves) and are indicative as at publication, subject to revision by the relevant authorities. Cells drawn from five transactions or fewer are marked thin and should not be read as market rates. Rebuild, A&A and renovation costs and construction timelines are industry ranges, not quotations, and move with the tender market. Building height and envelope parameters are subject to the prevailing URA guidelines for the specific plot and must be confirmed by a qualified person. Tenure, school and connectivity facts are as at publication. Published for educational purposes; nothing here is a valuation, an offer, or financial advice. Please check with a professional before making any property decision. See our full Disclaimer.
Create your account or sign in
One account unlocks every gated resource. New members create an account here; returning members use the same form to sign in.